 F4LUFTBILDER
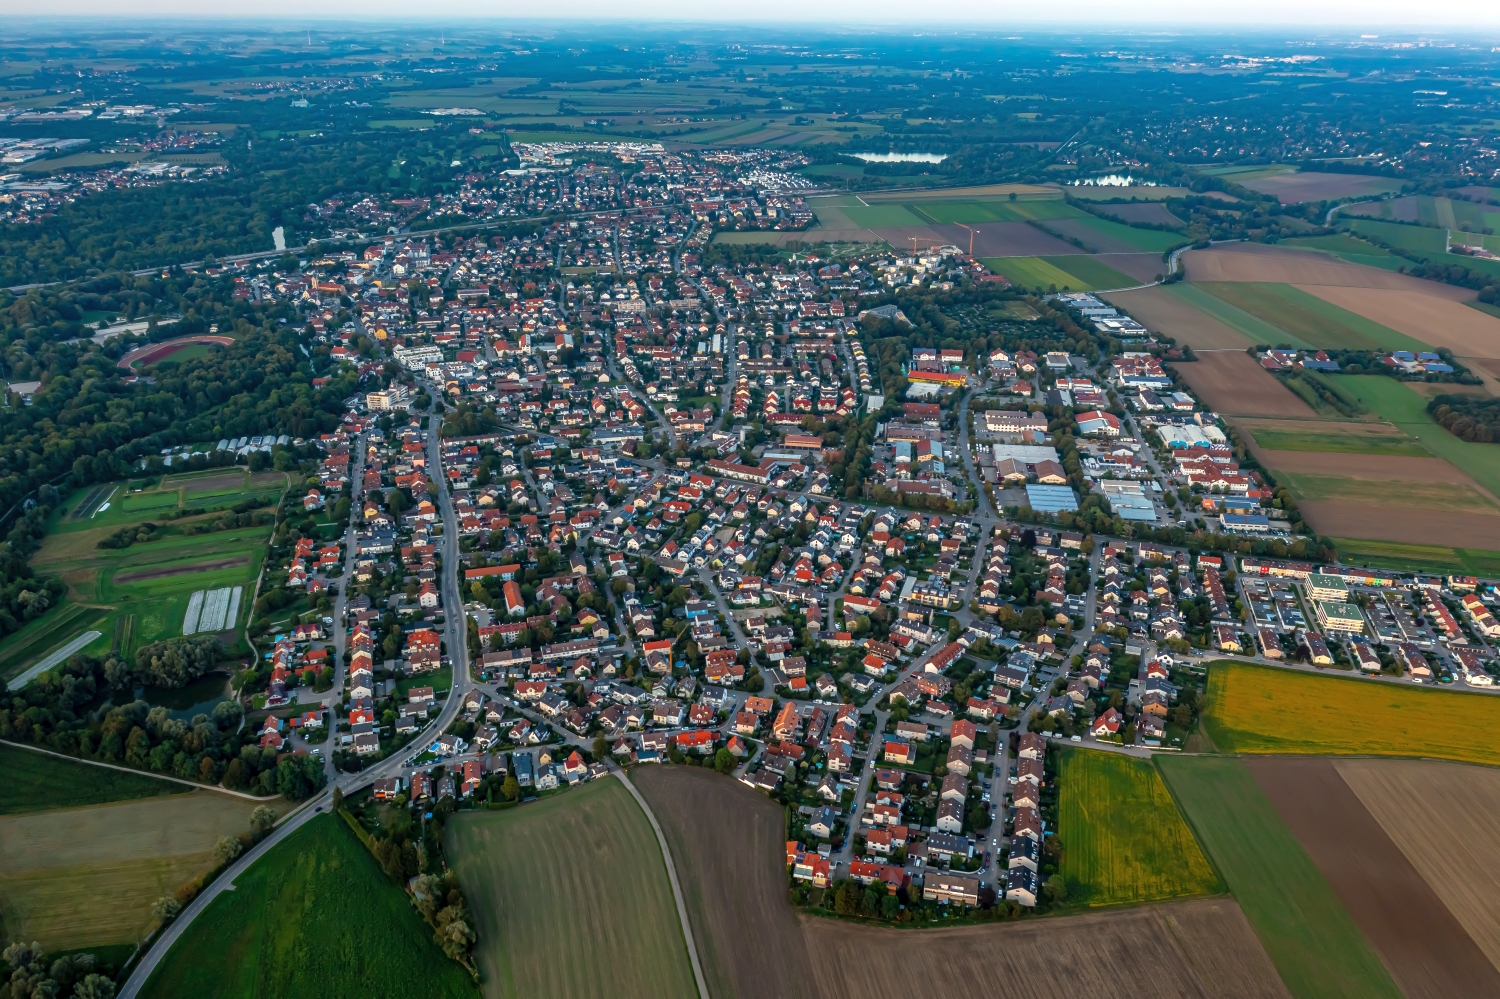
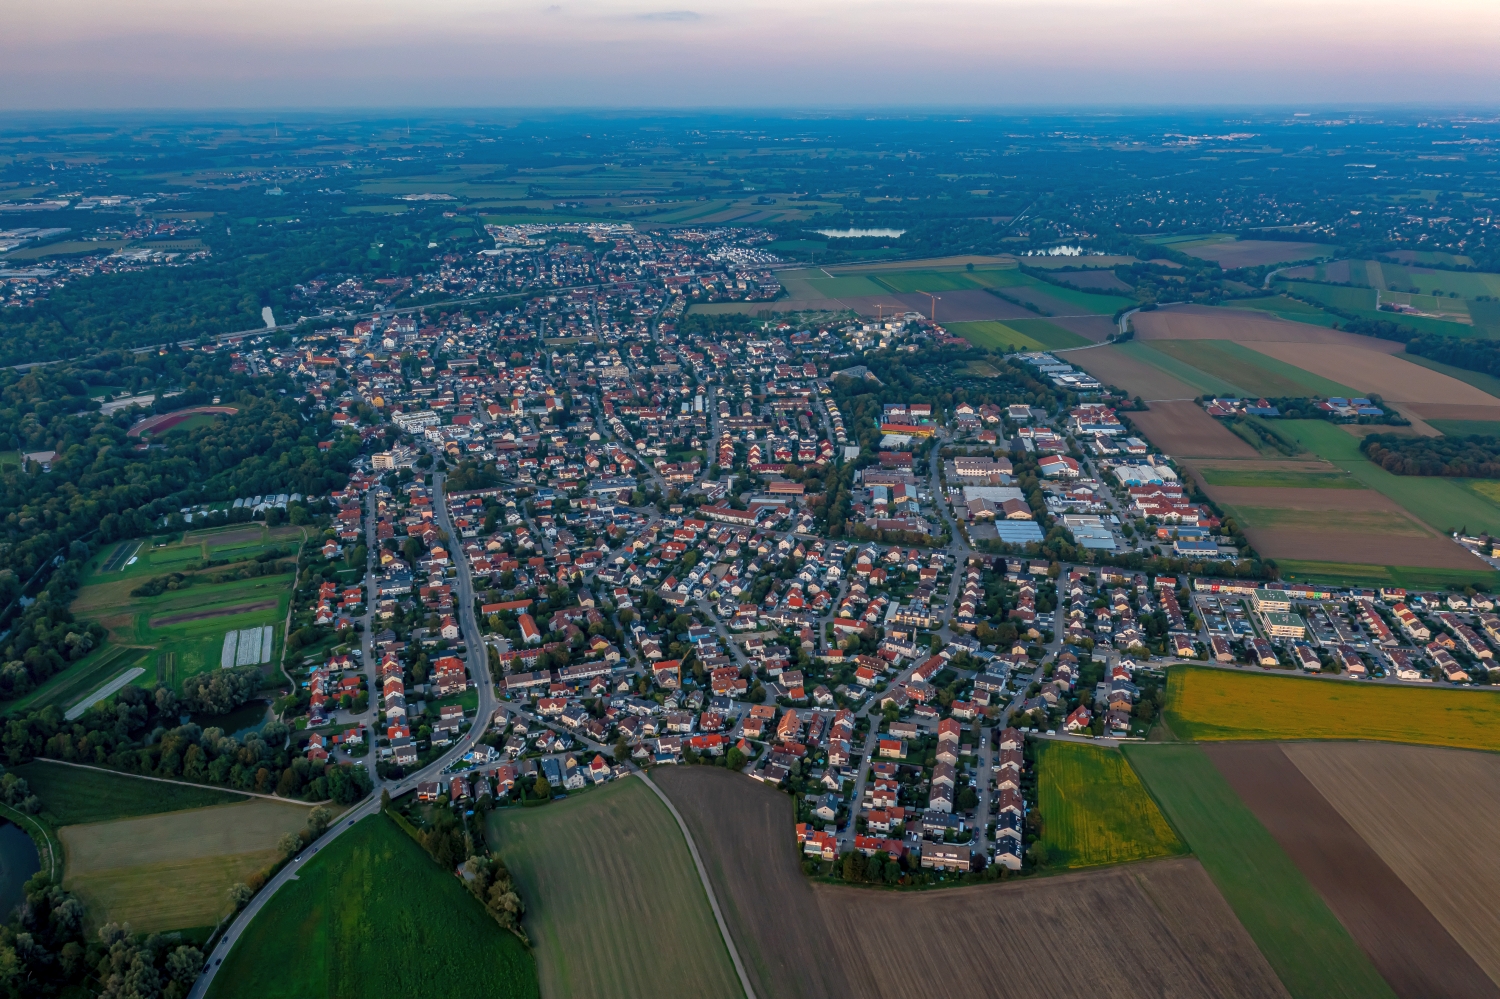
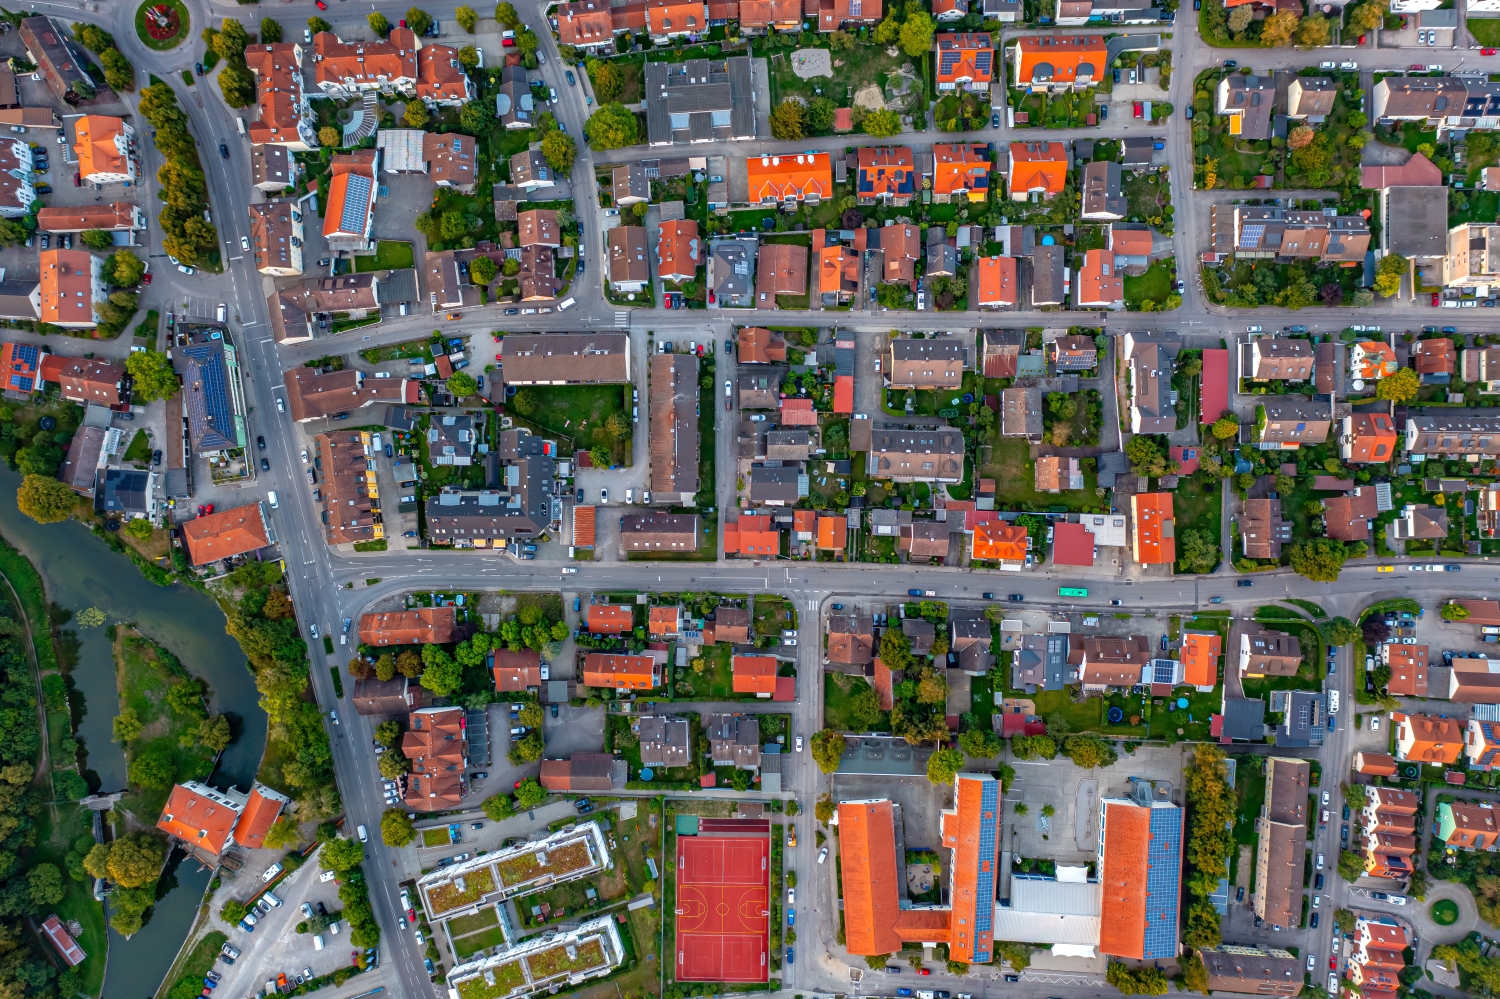
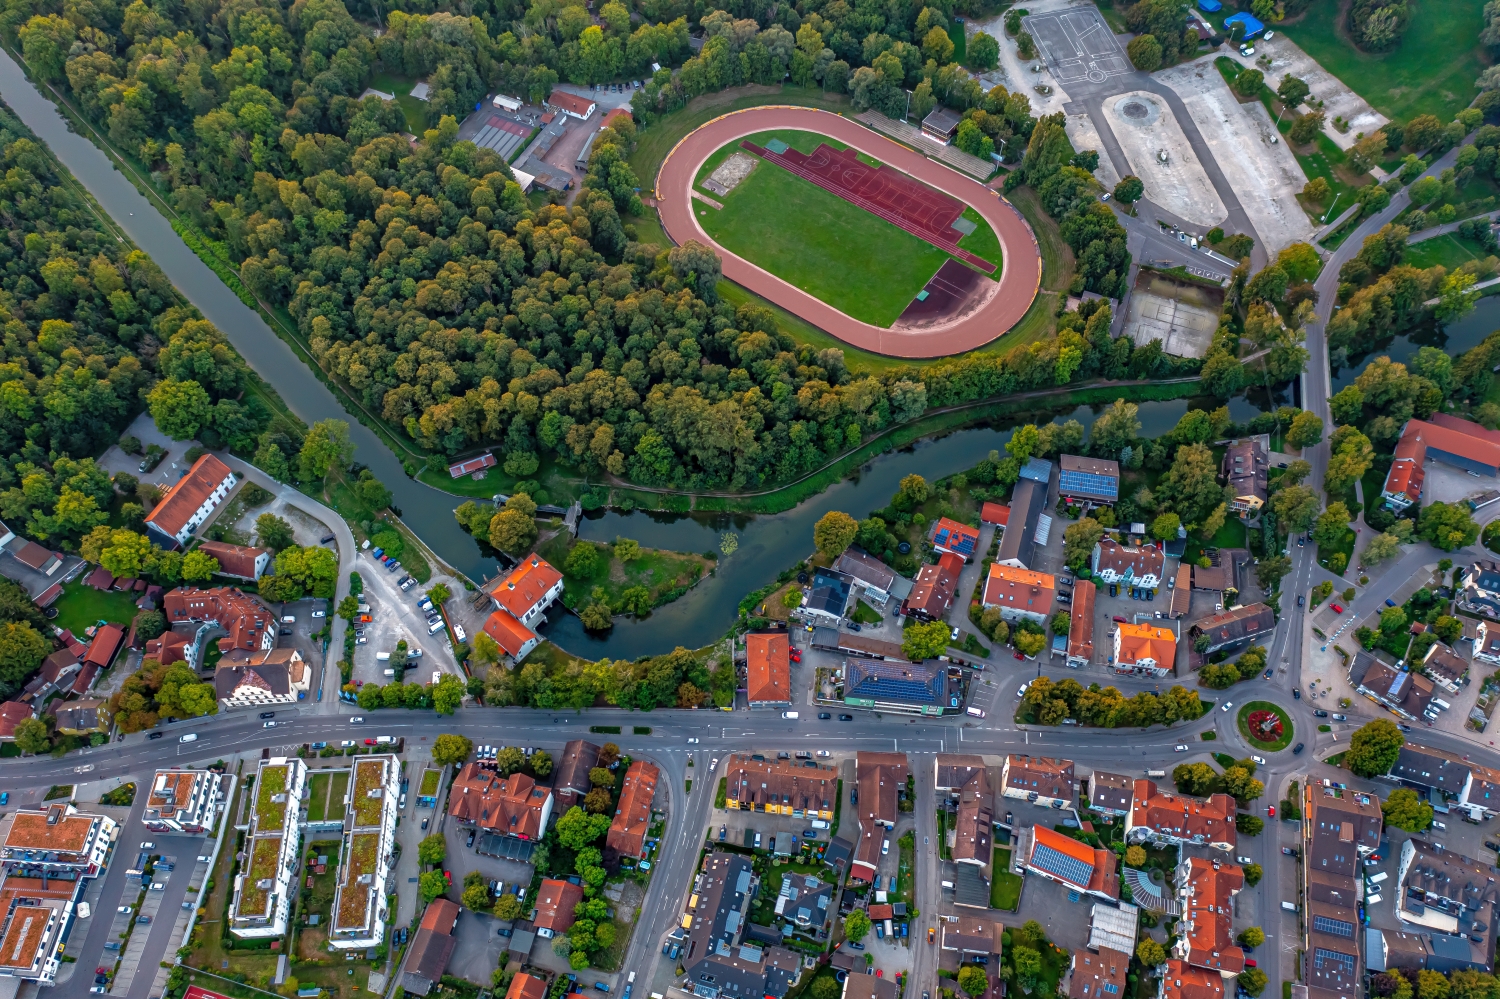
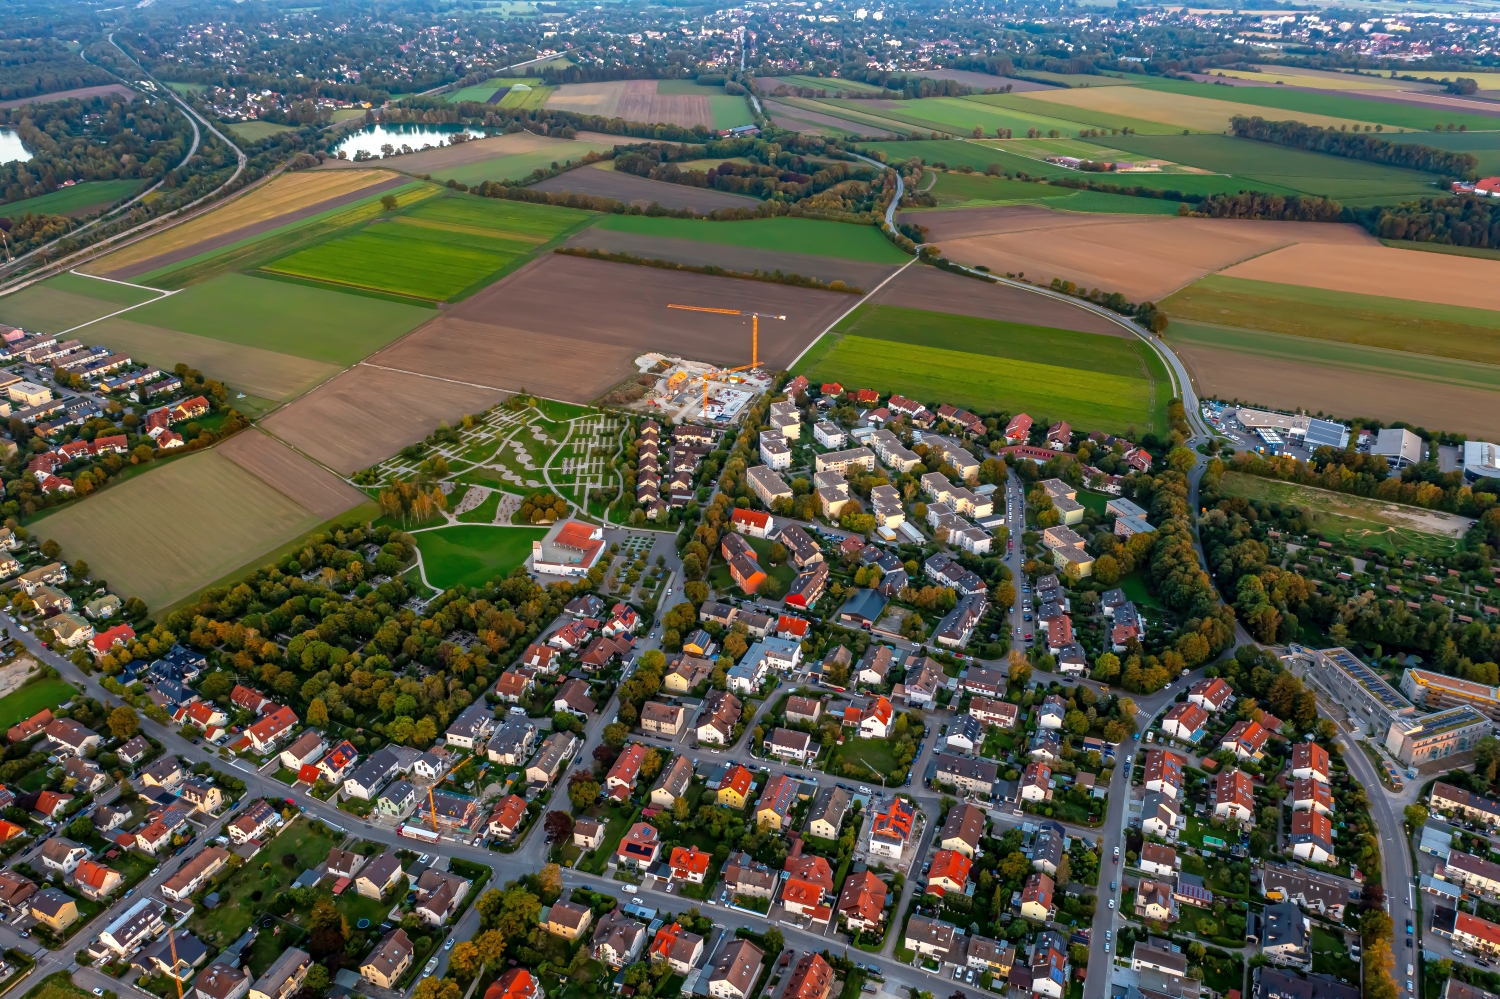
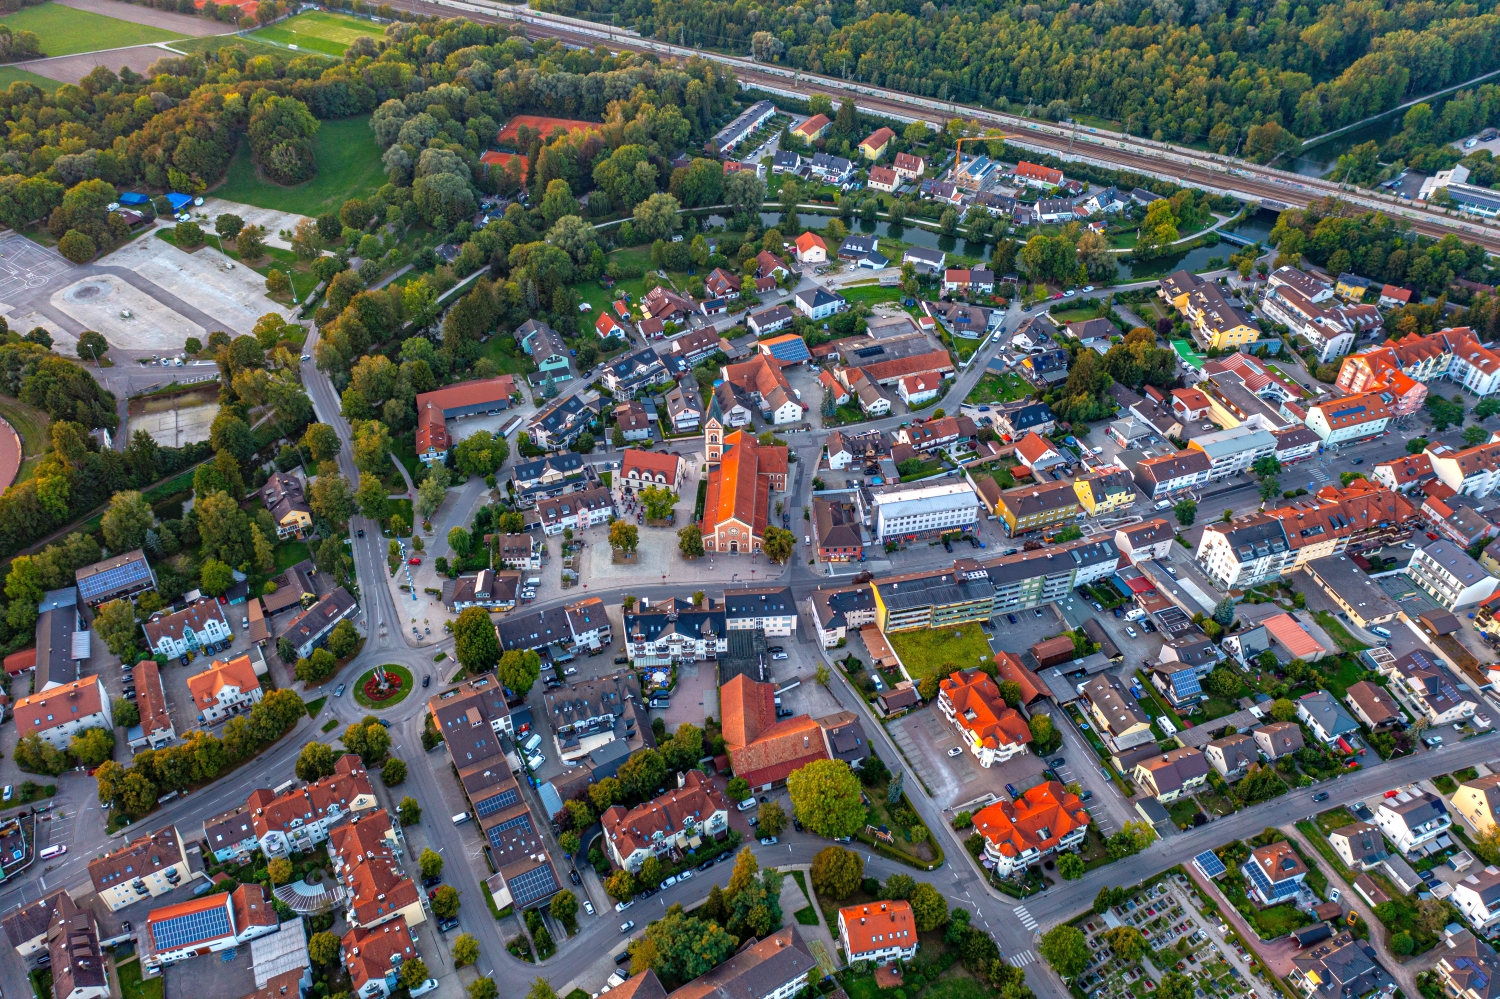
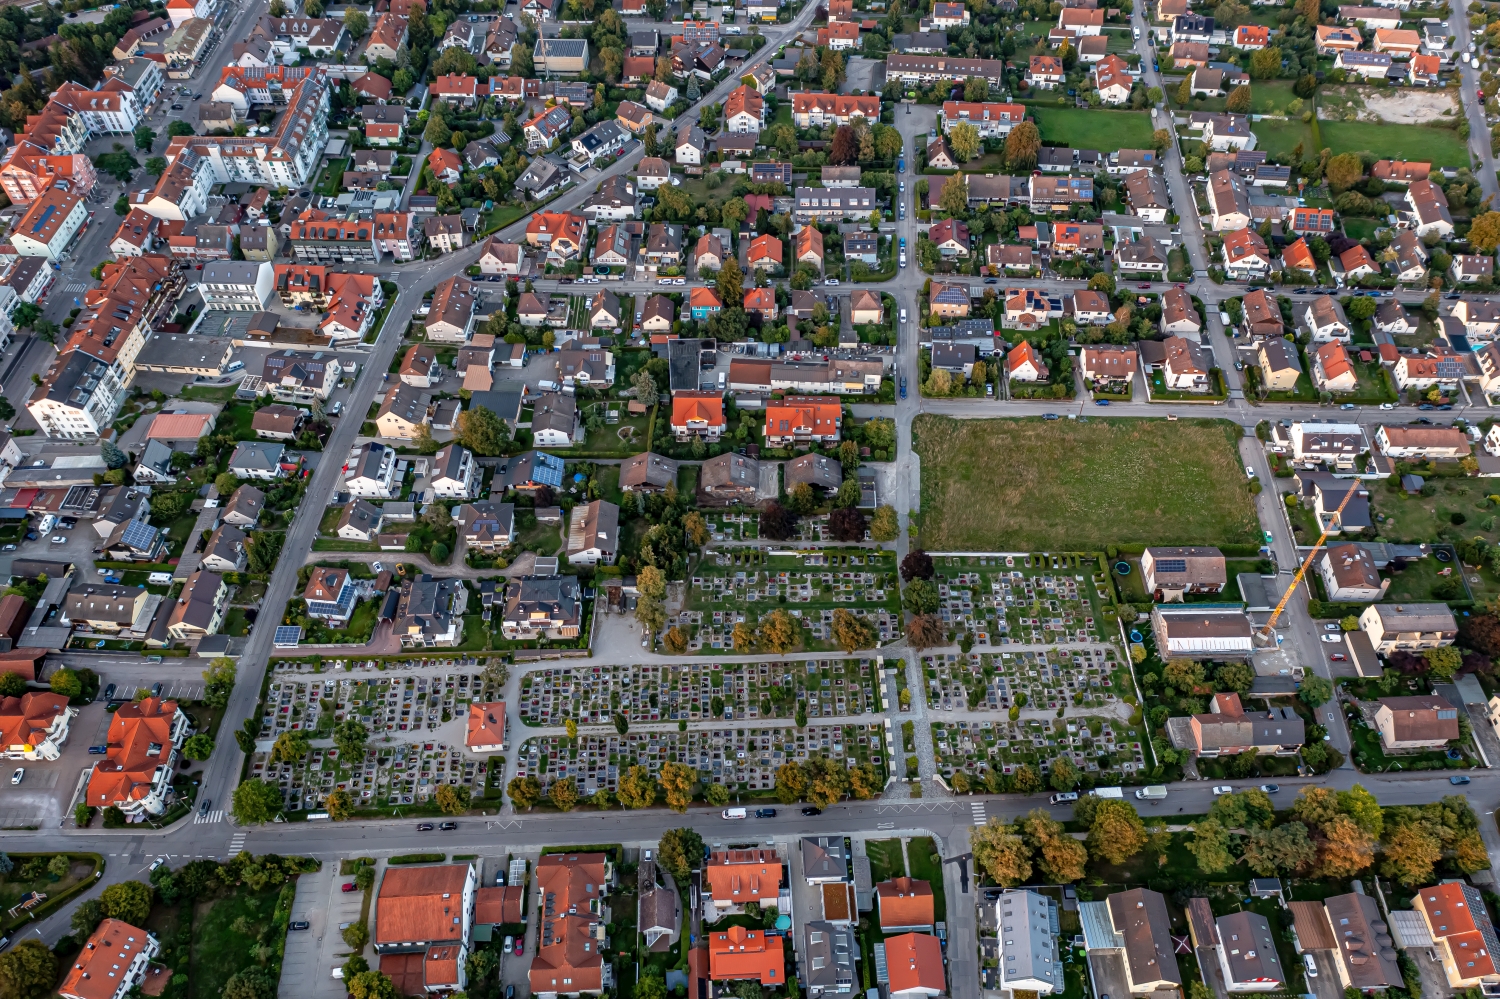
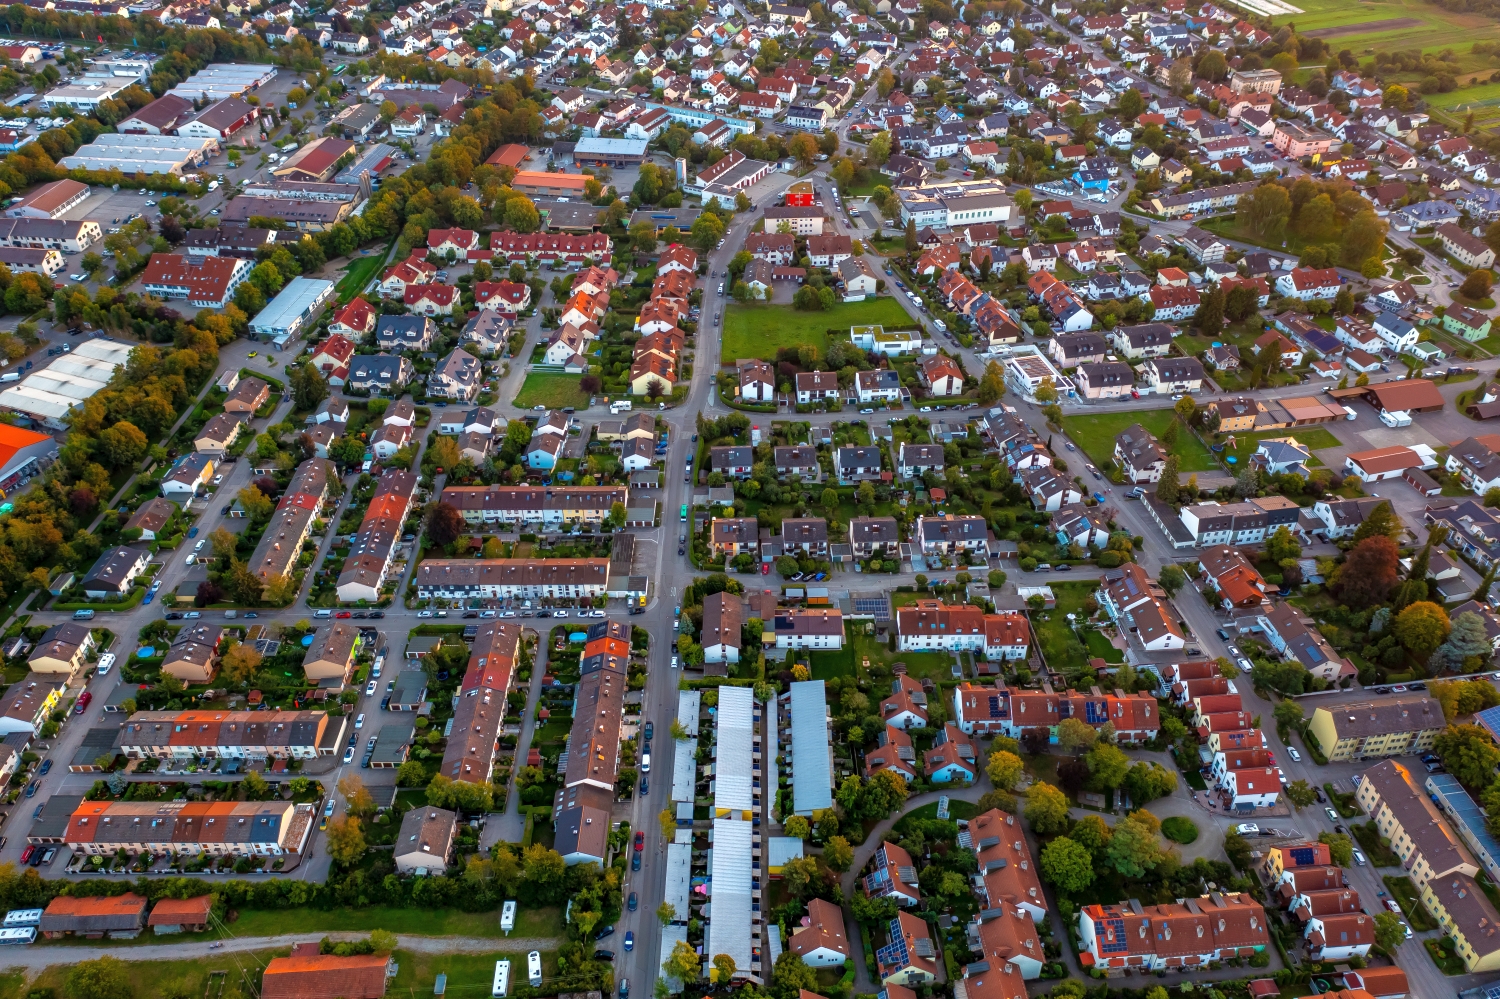
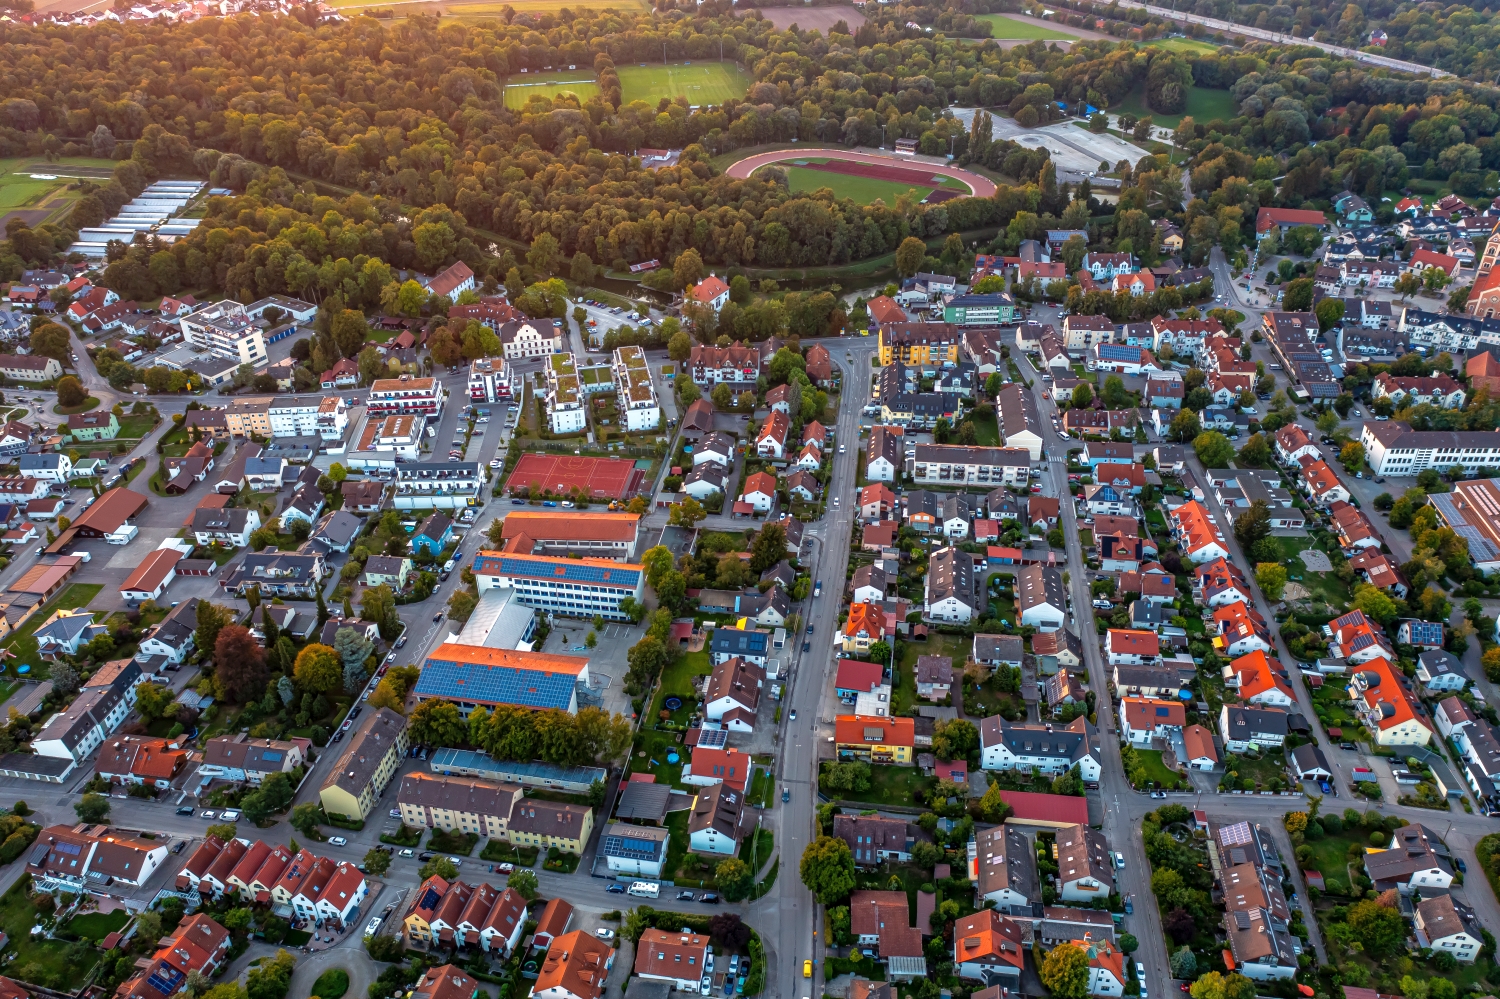
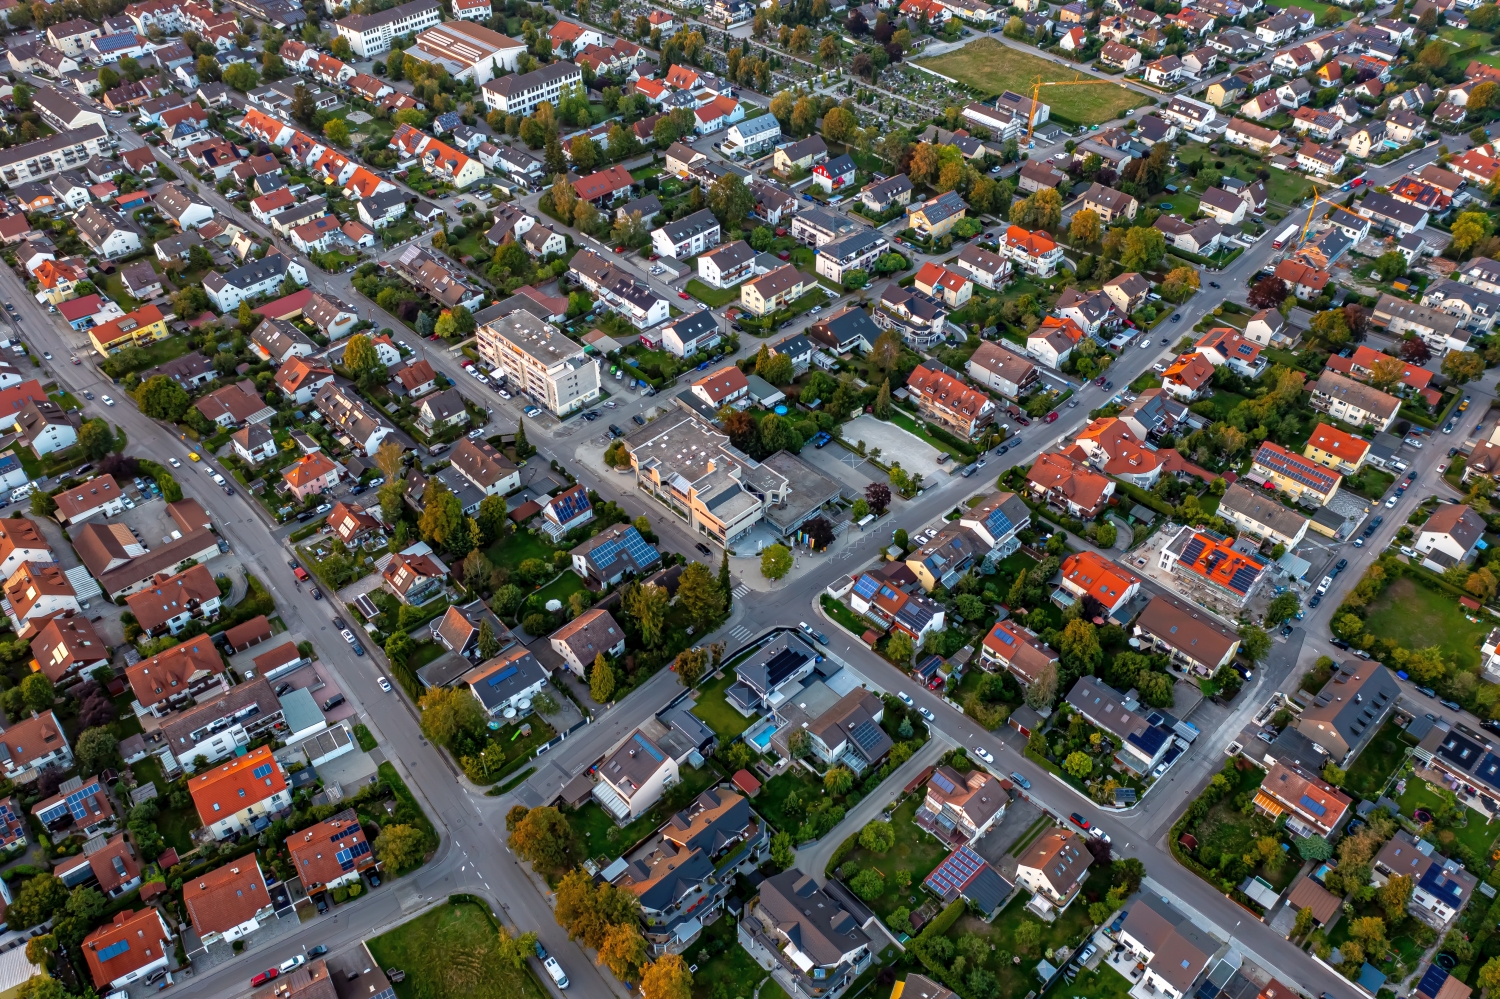
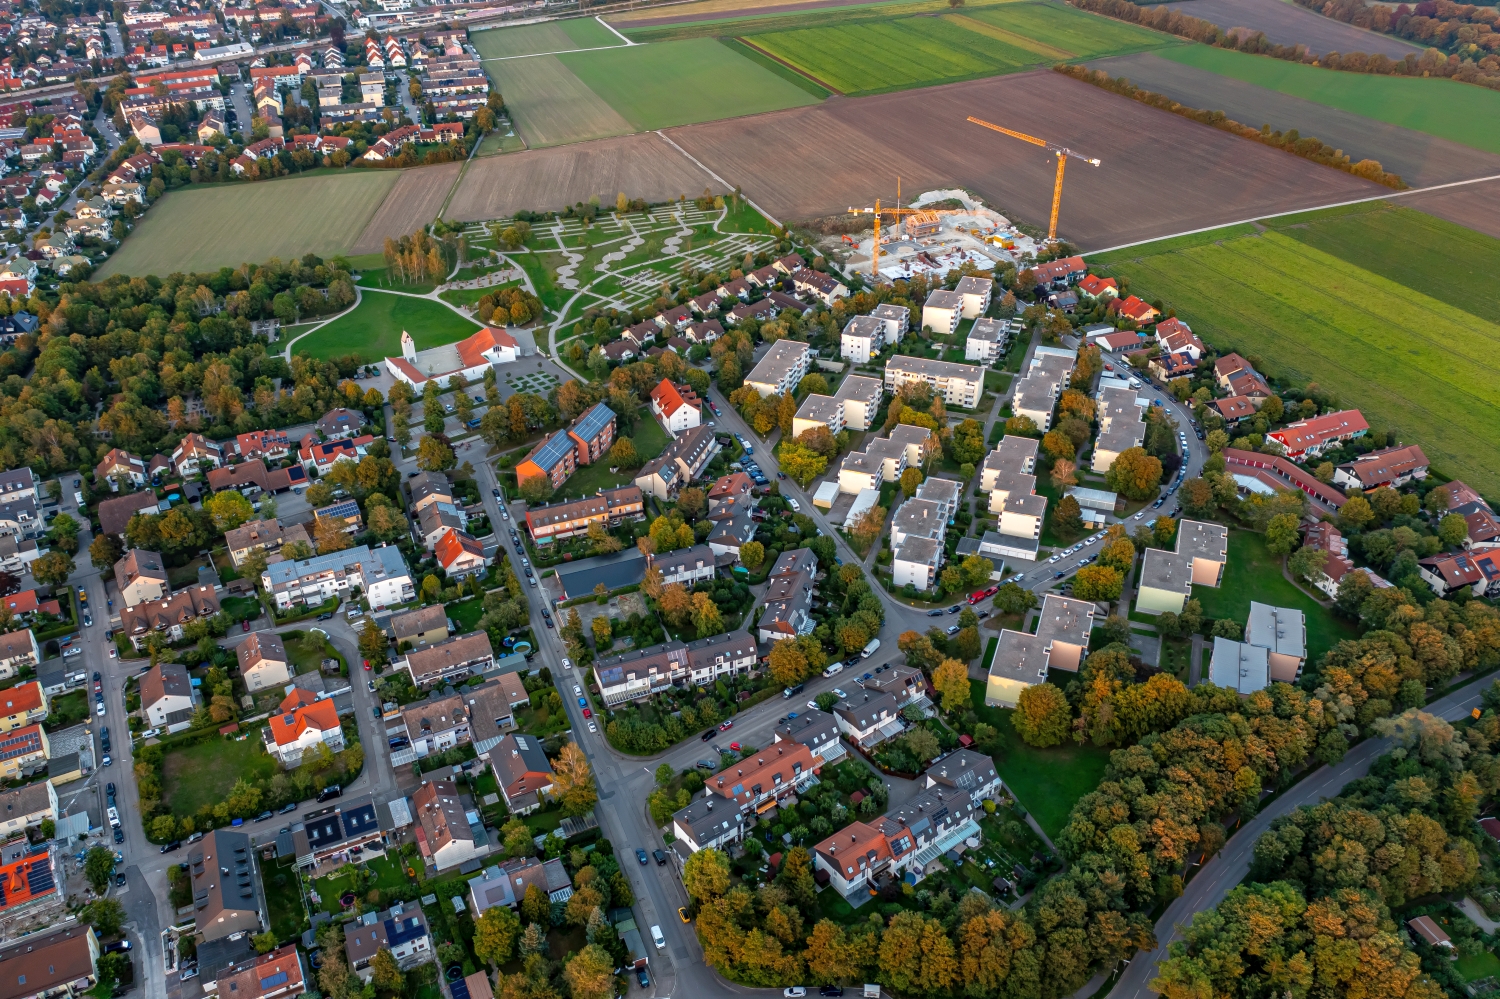
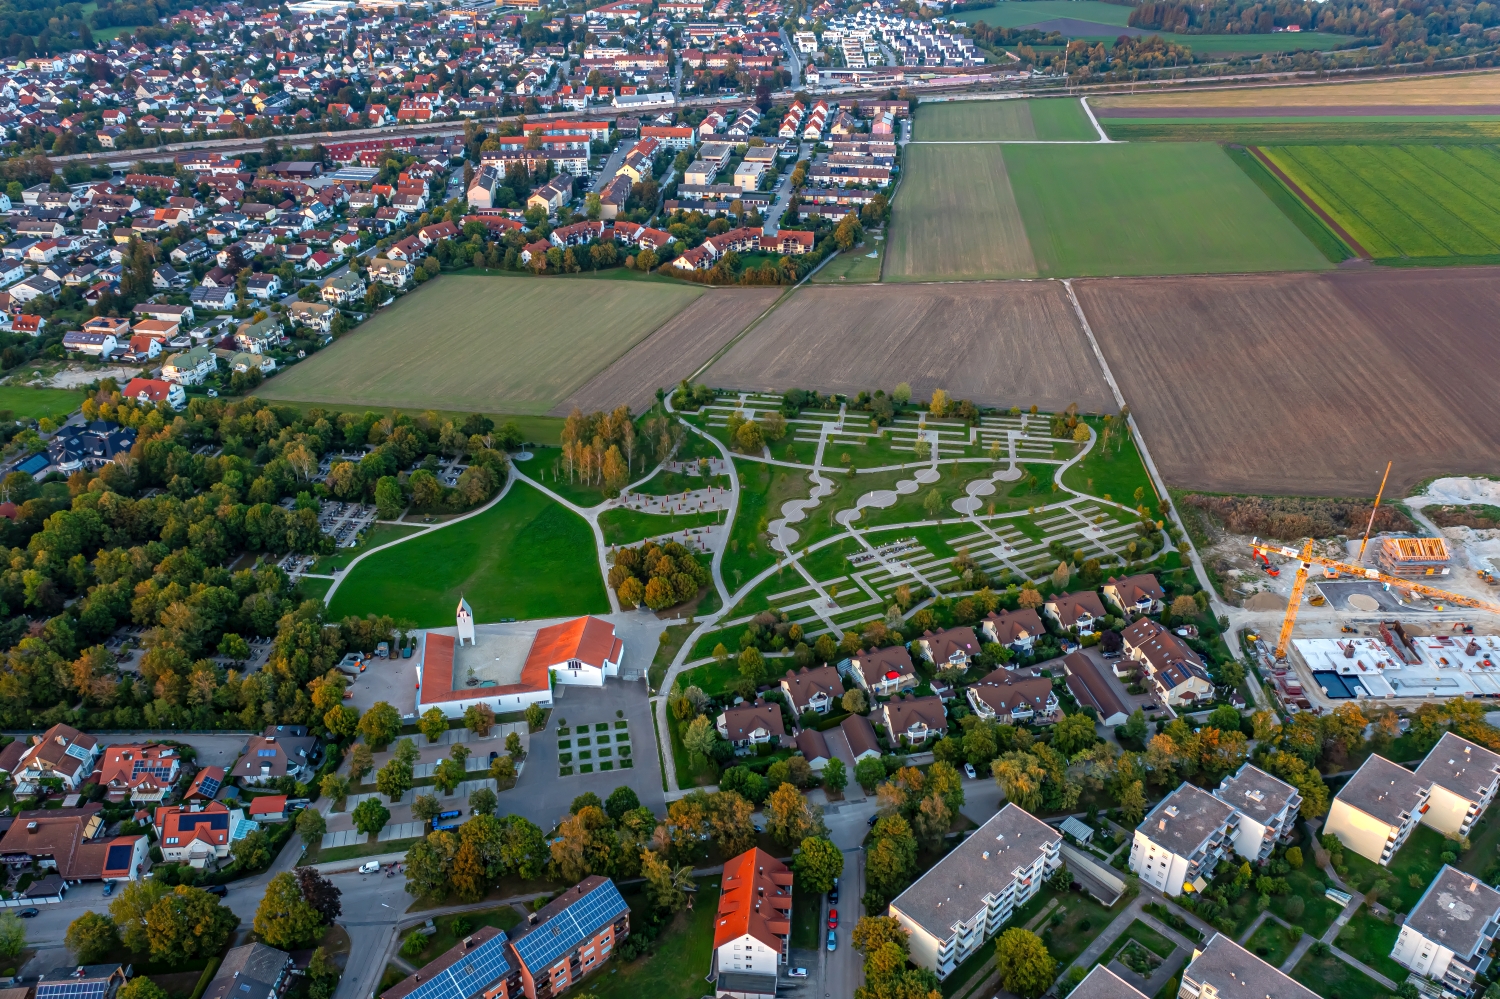
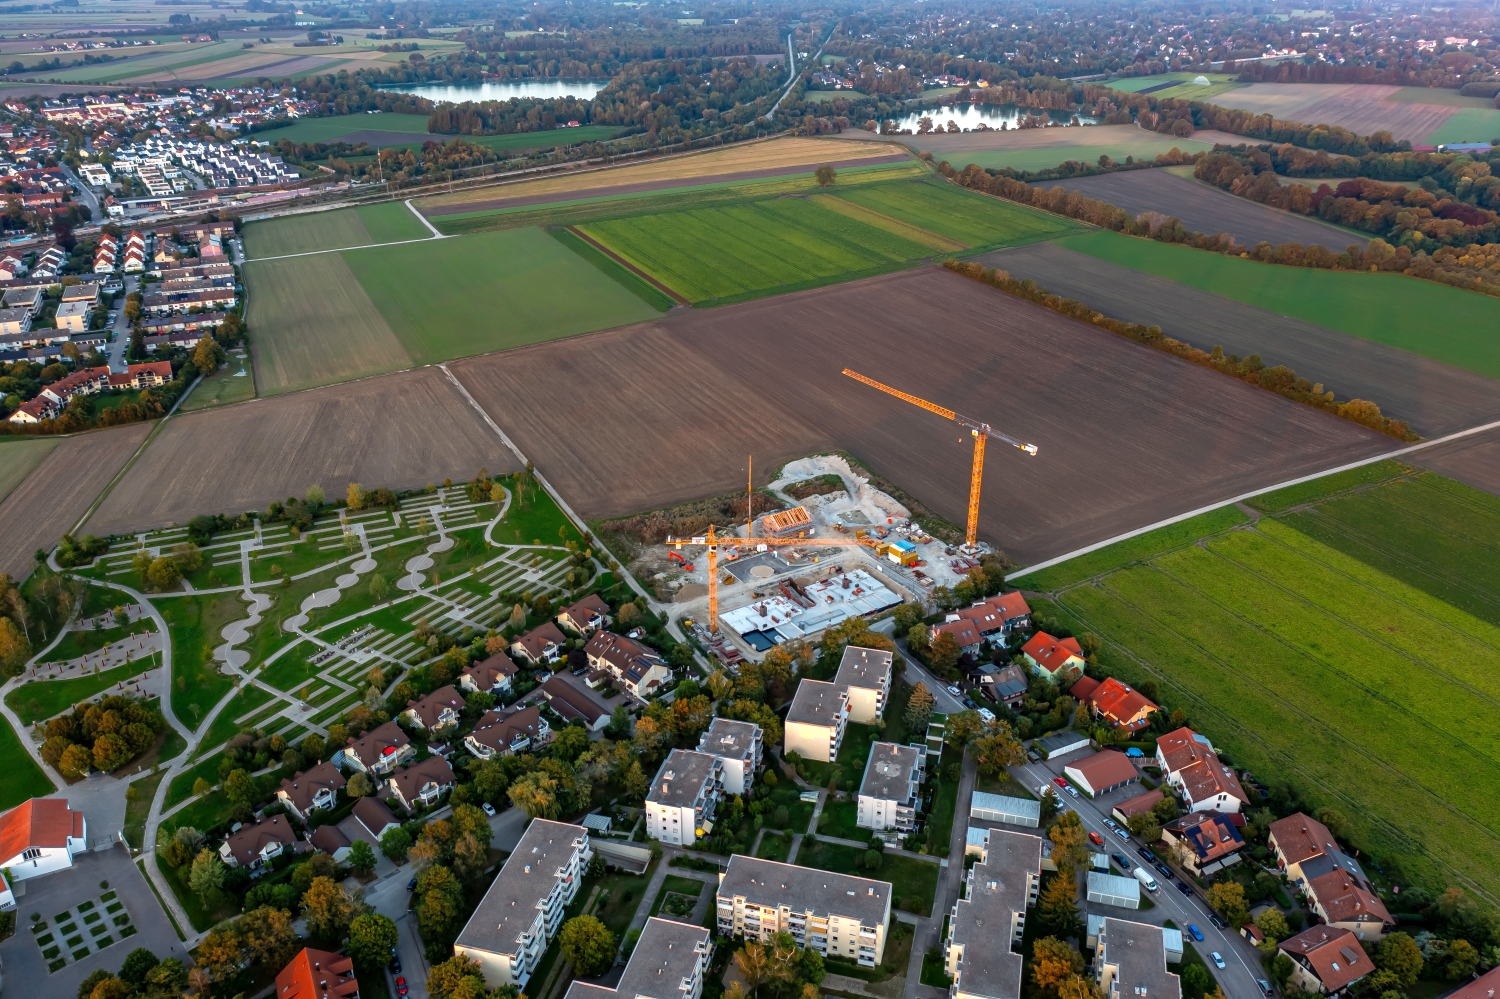
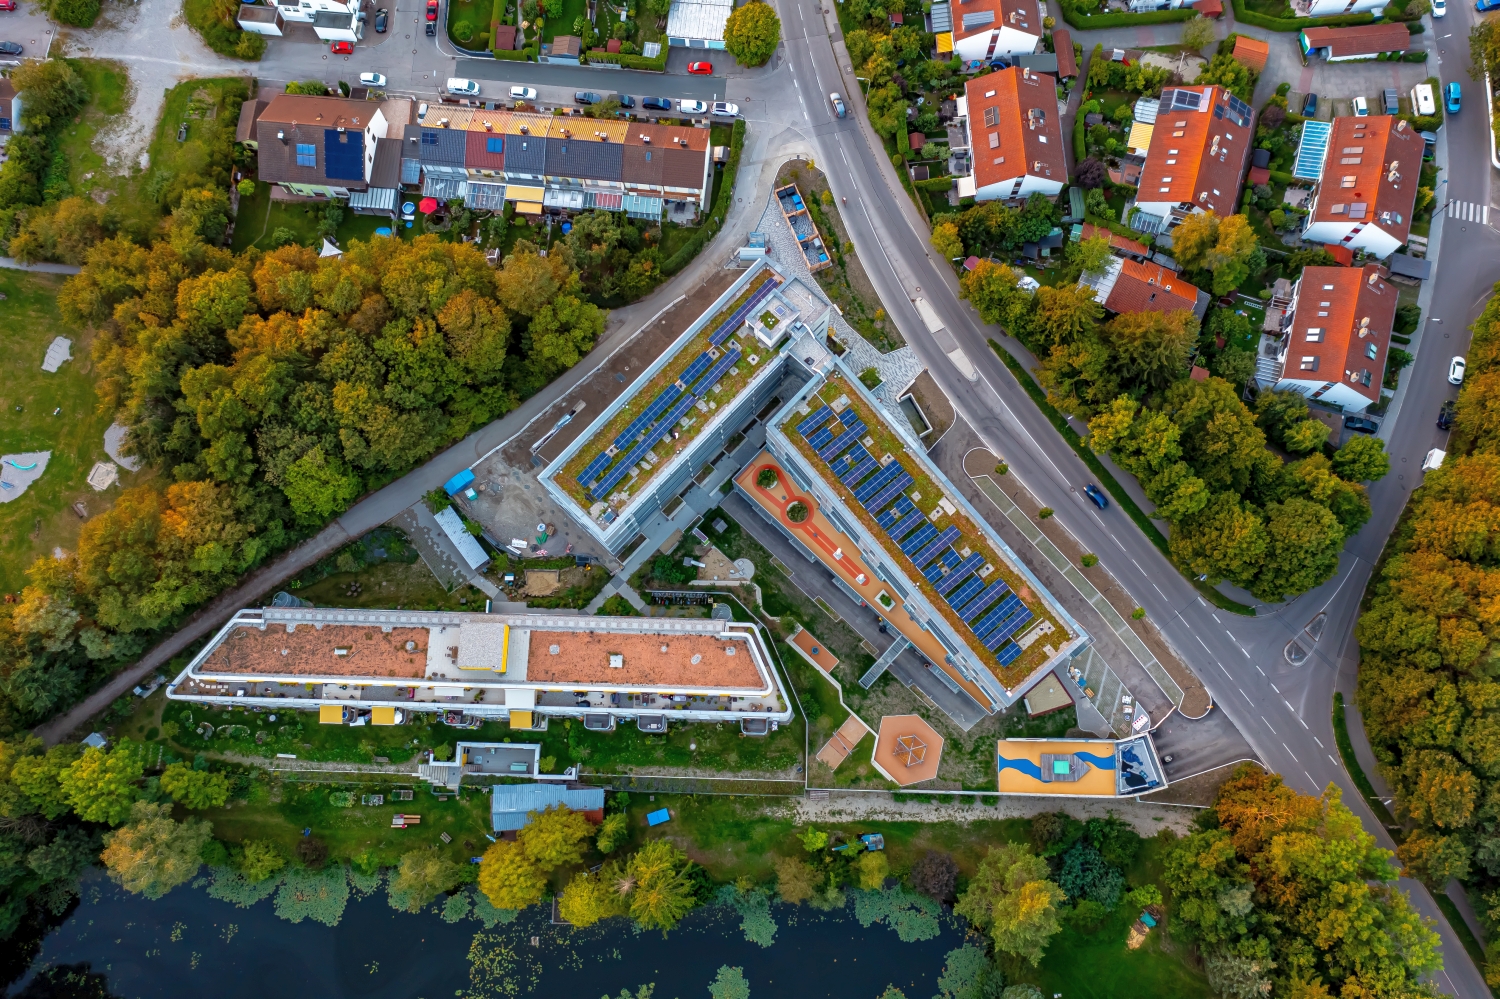
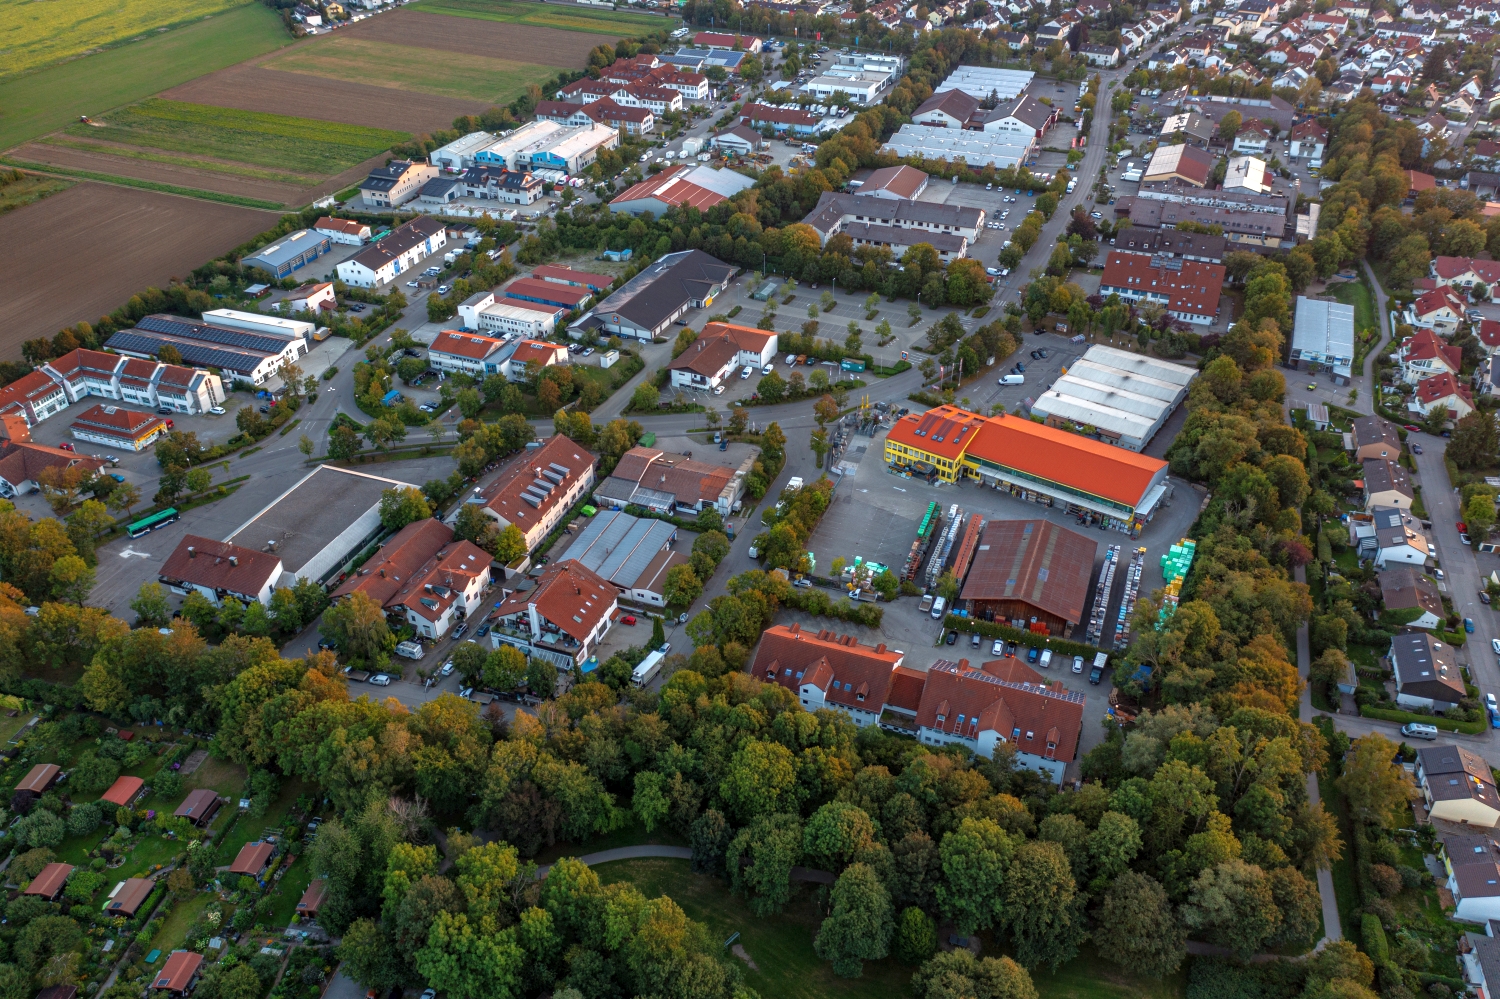
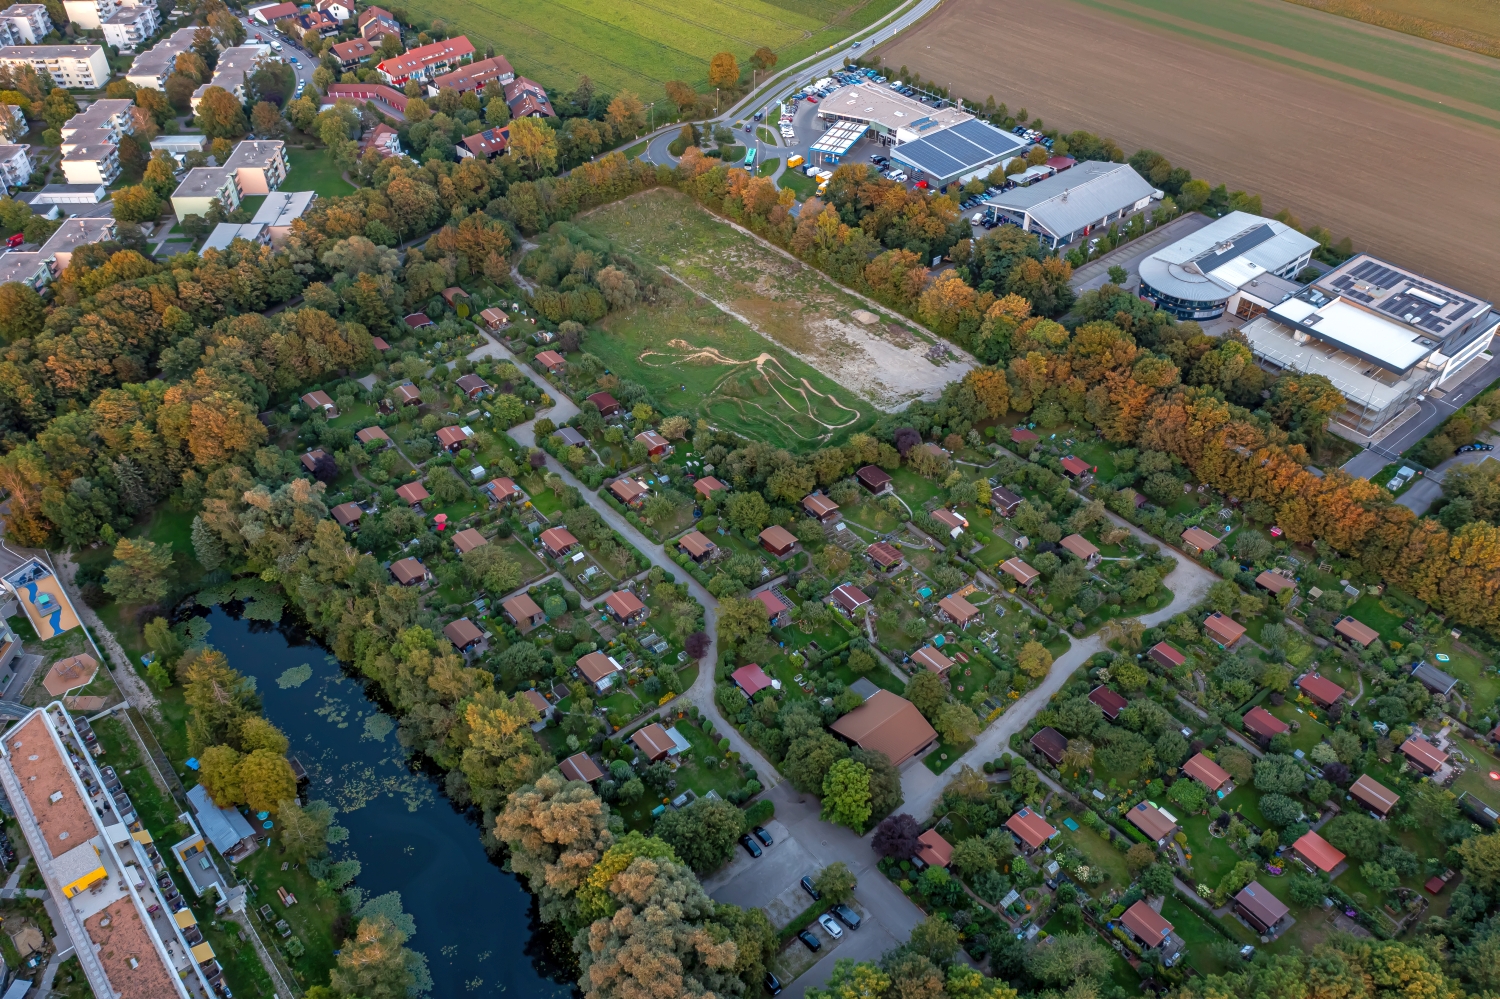
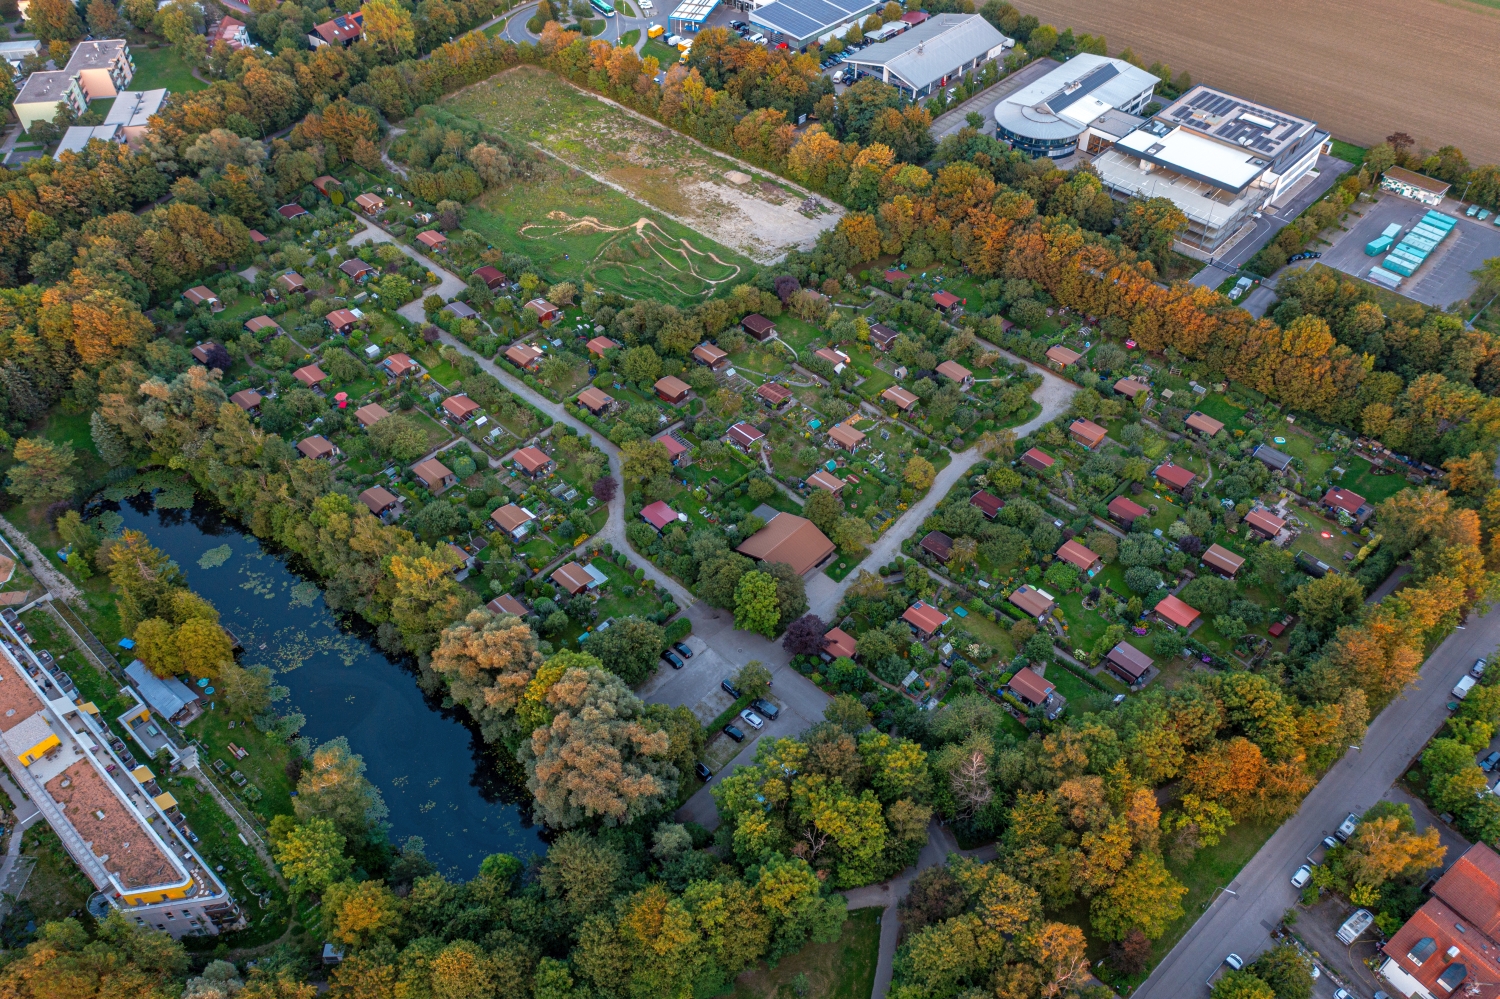
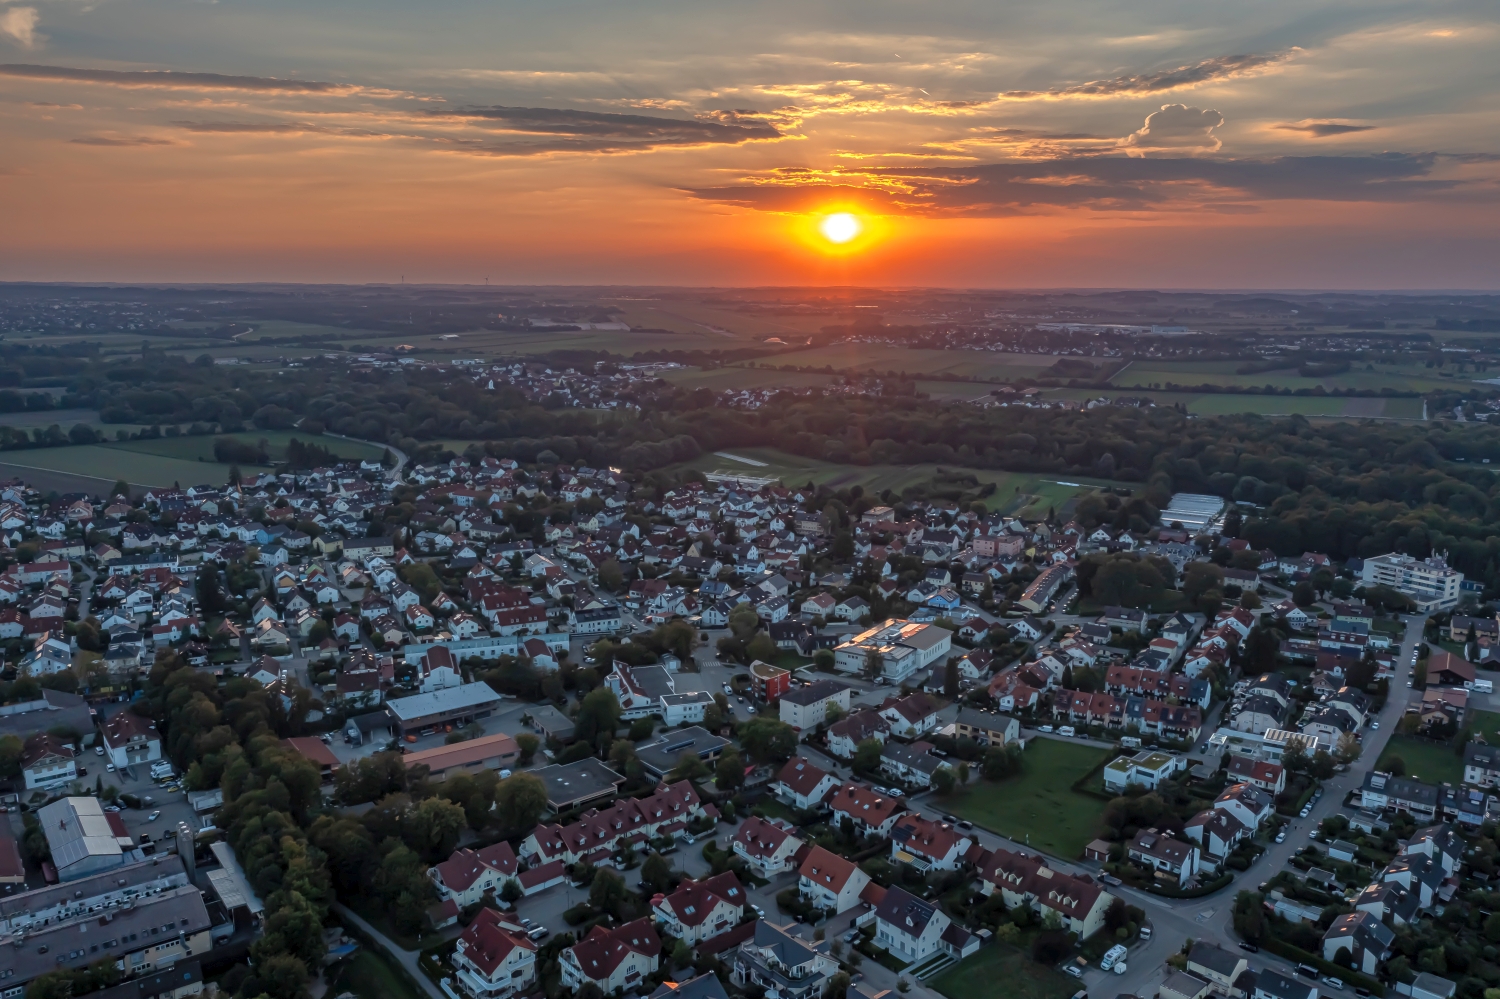
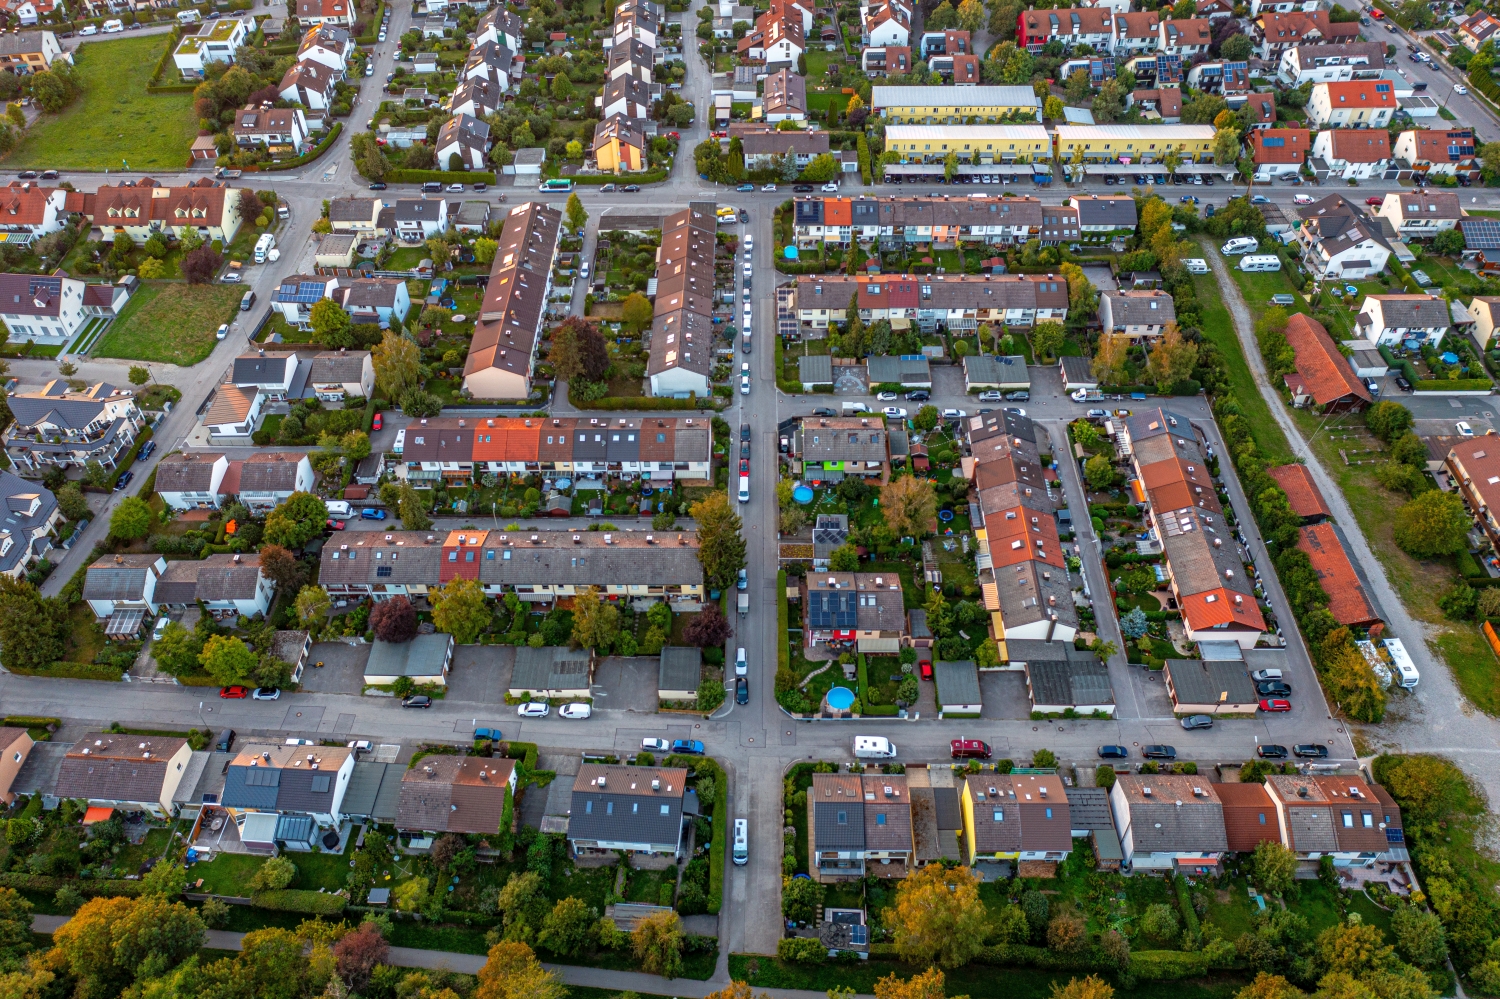
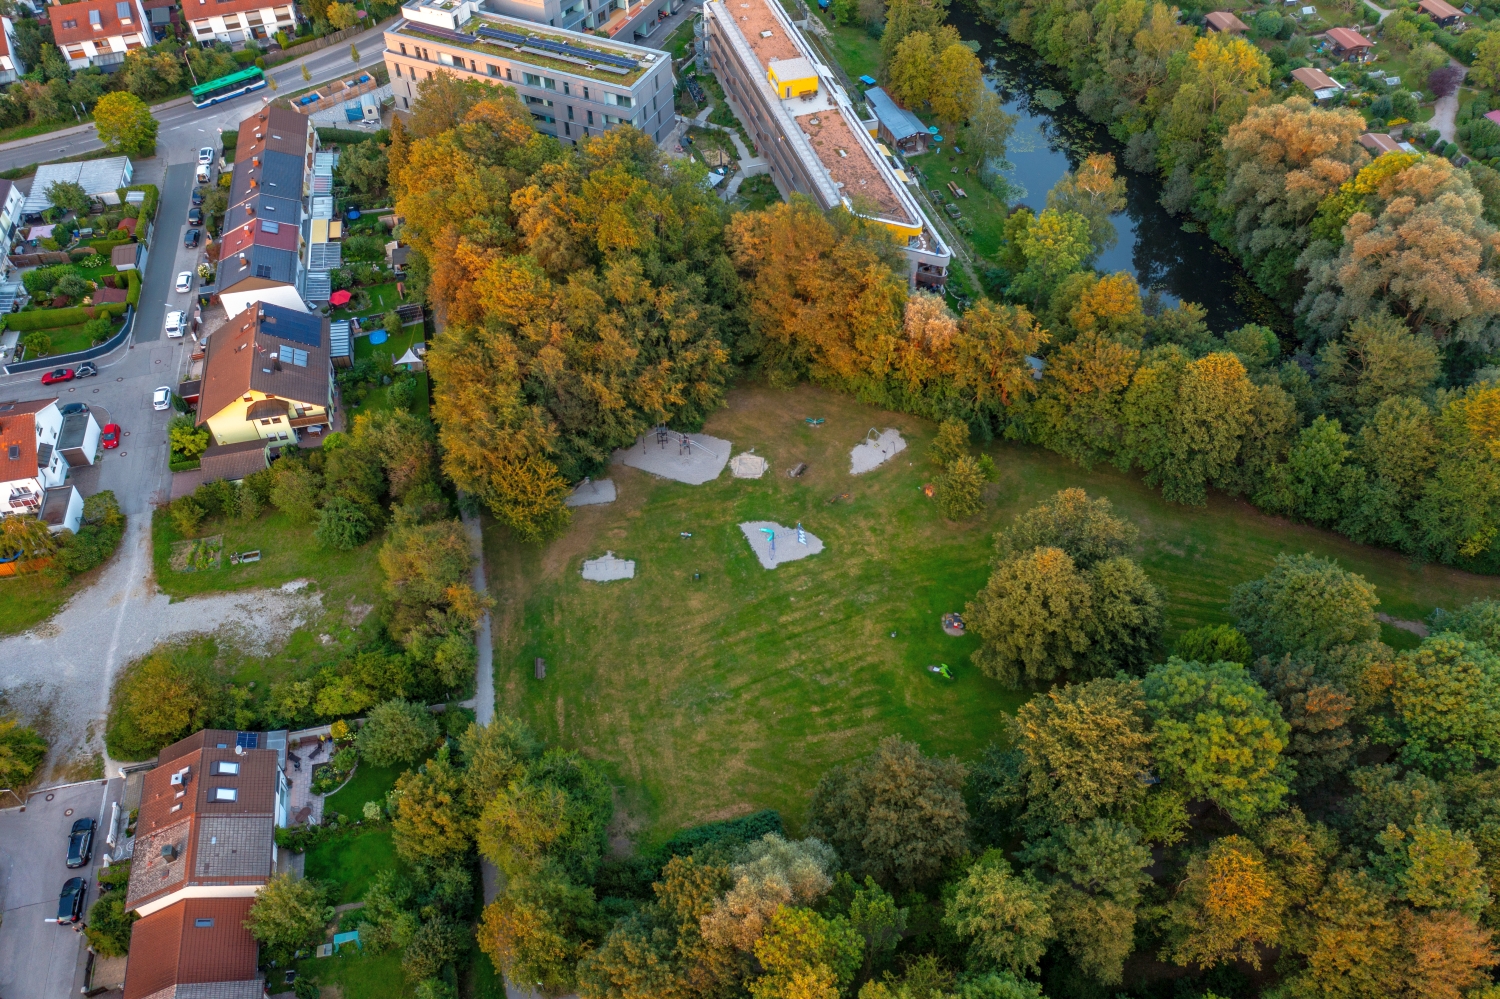
Sports areas and residential streets in Olching
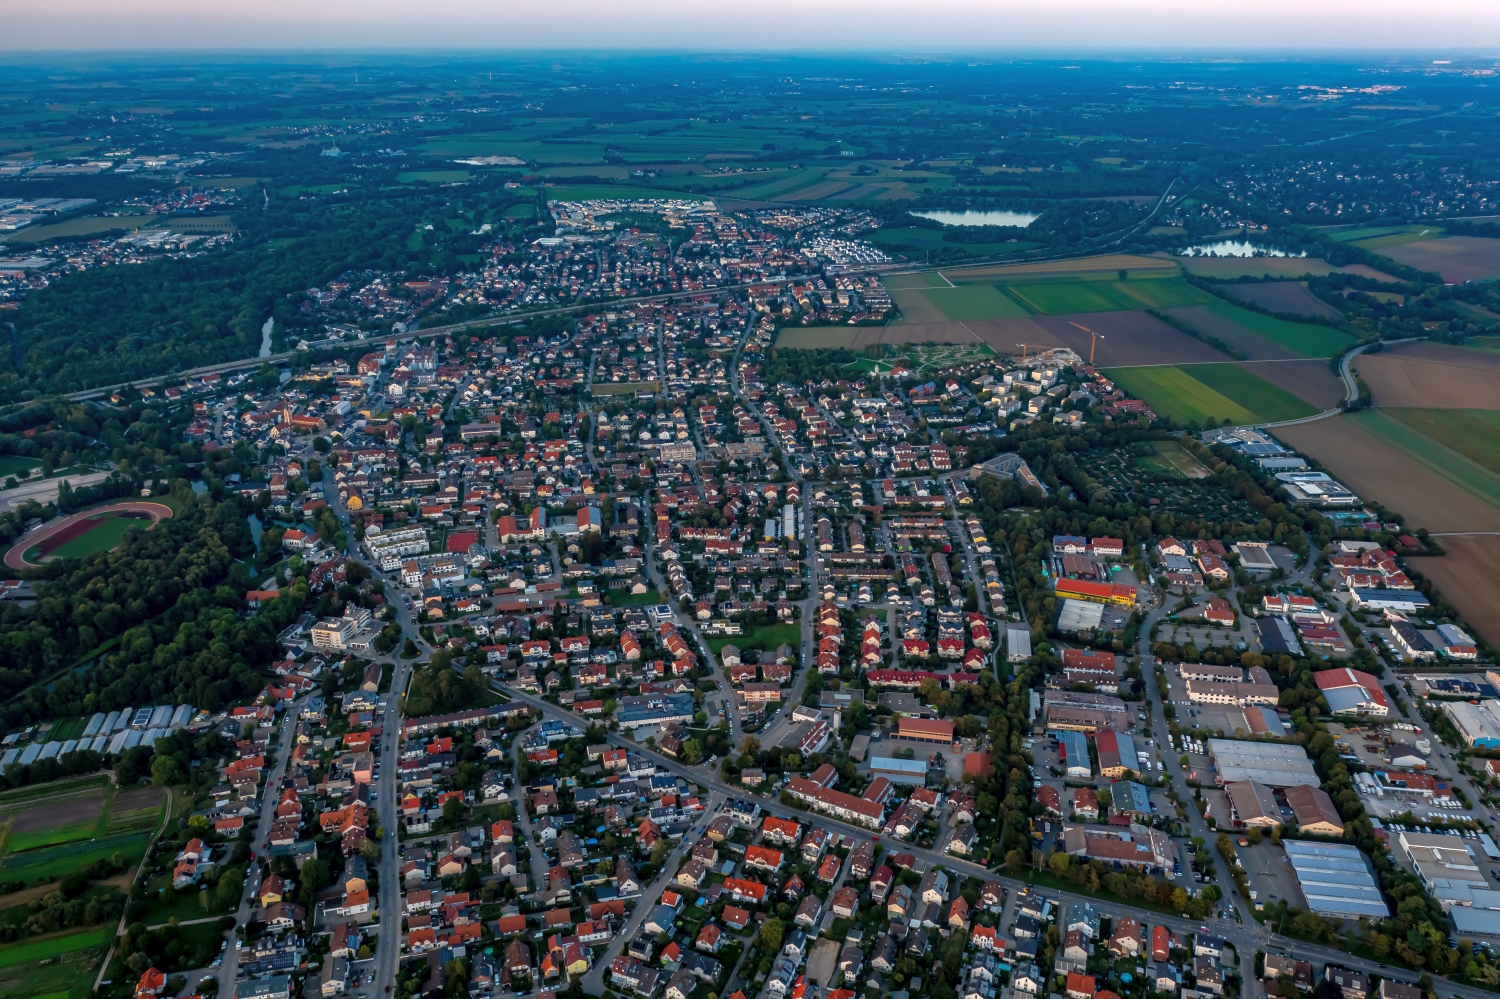
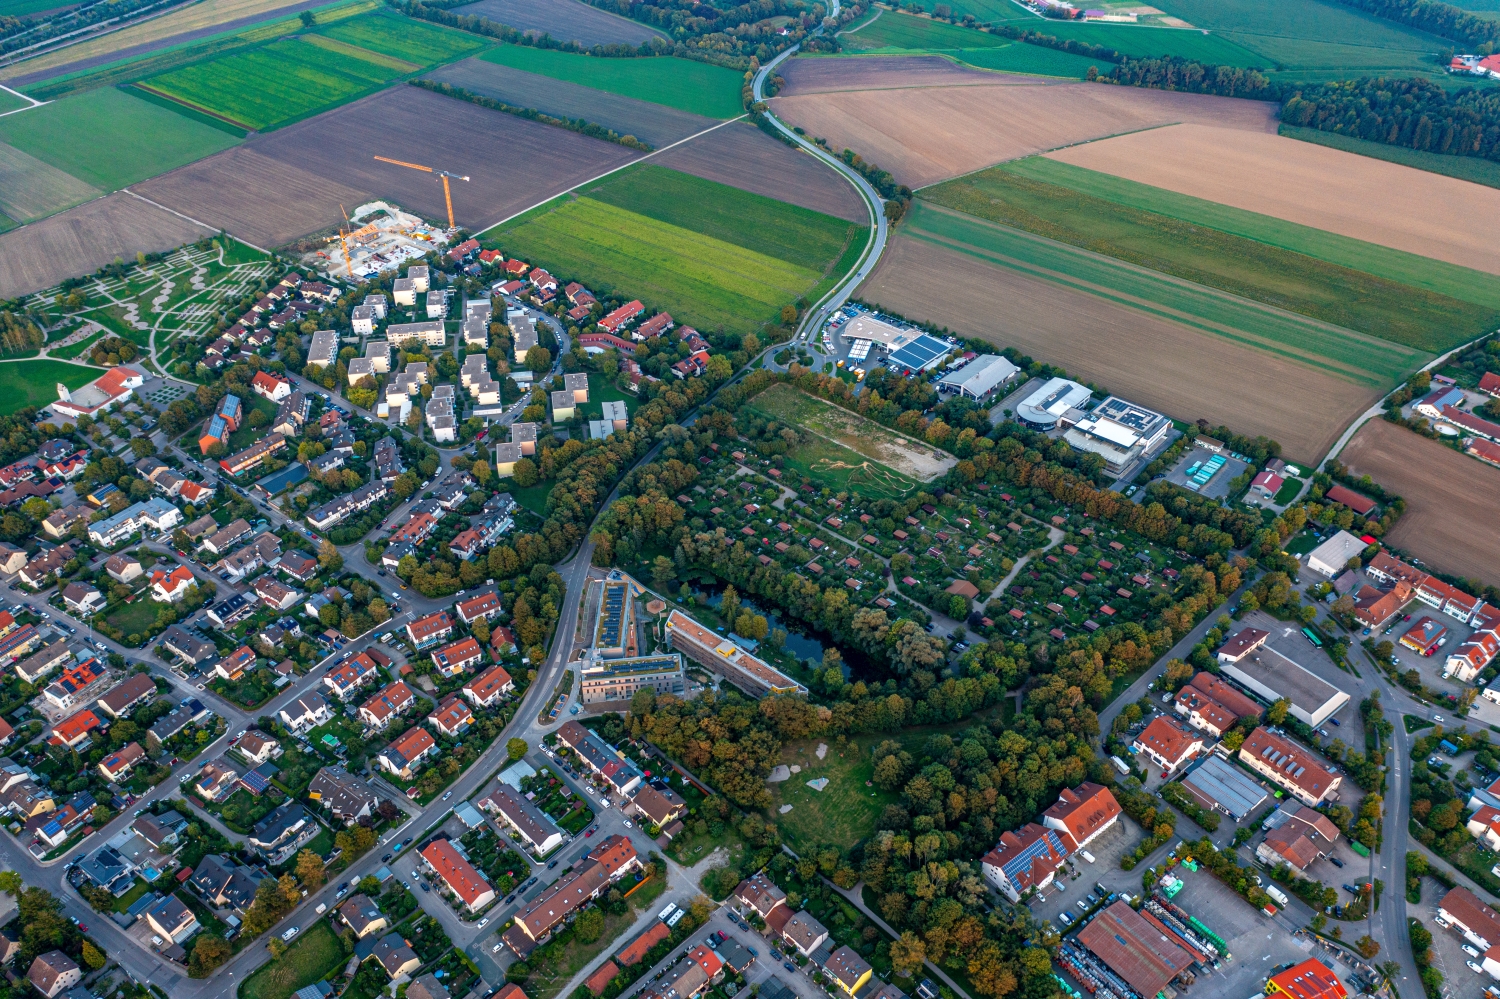
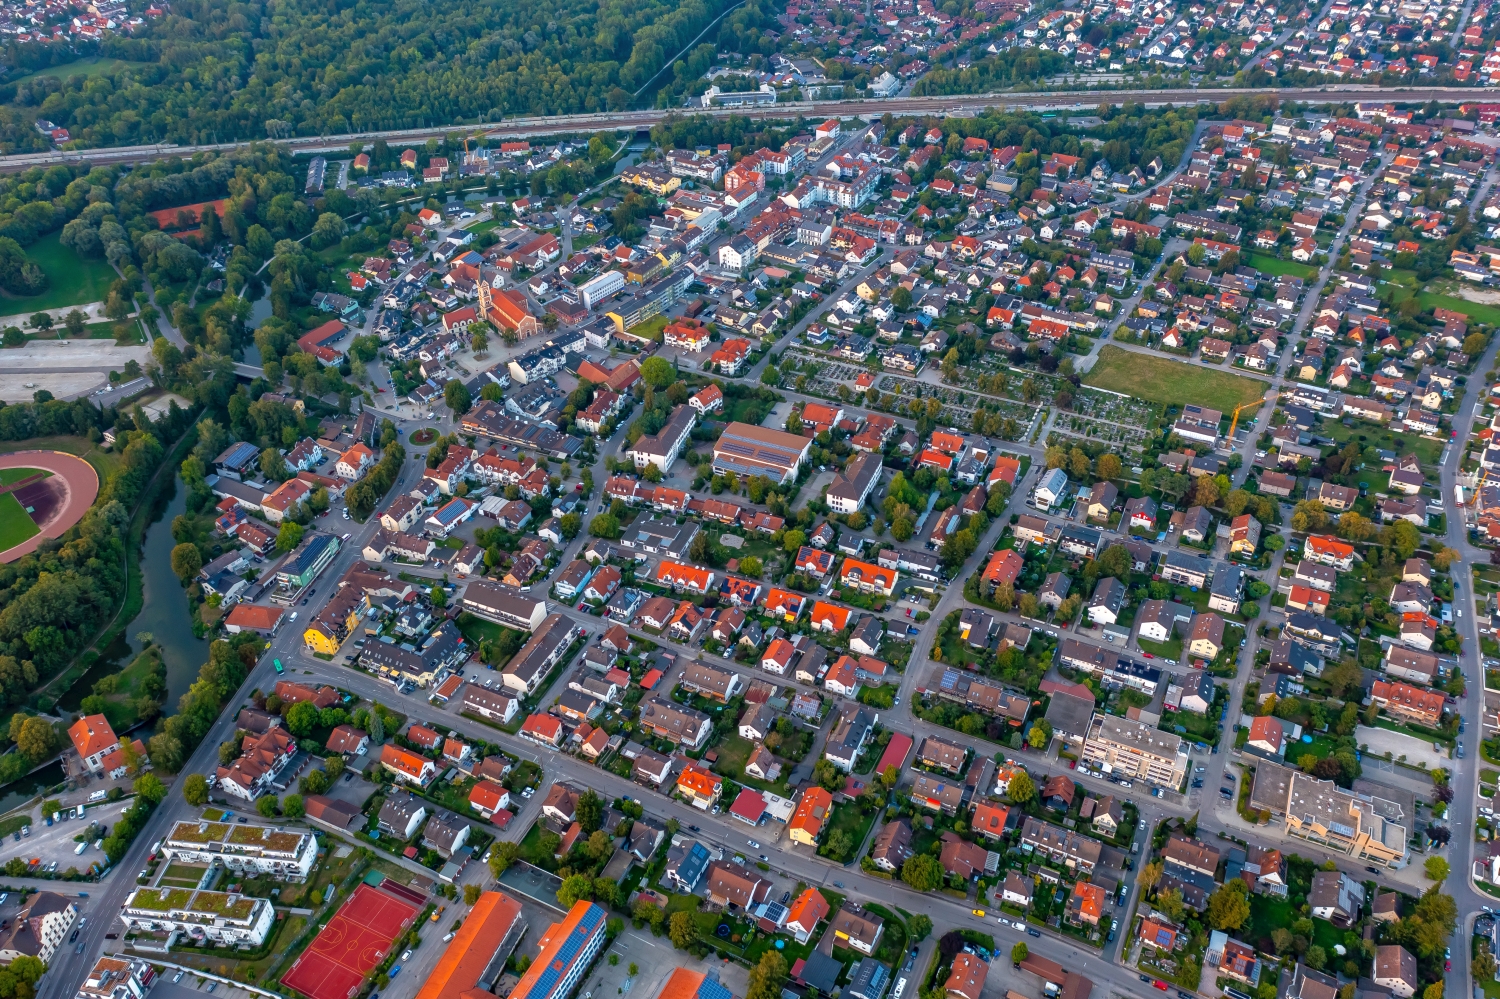
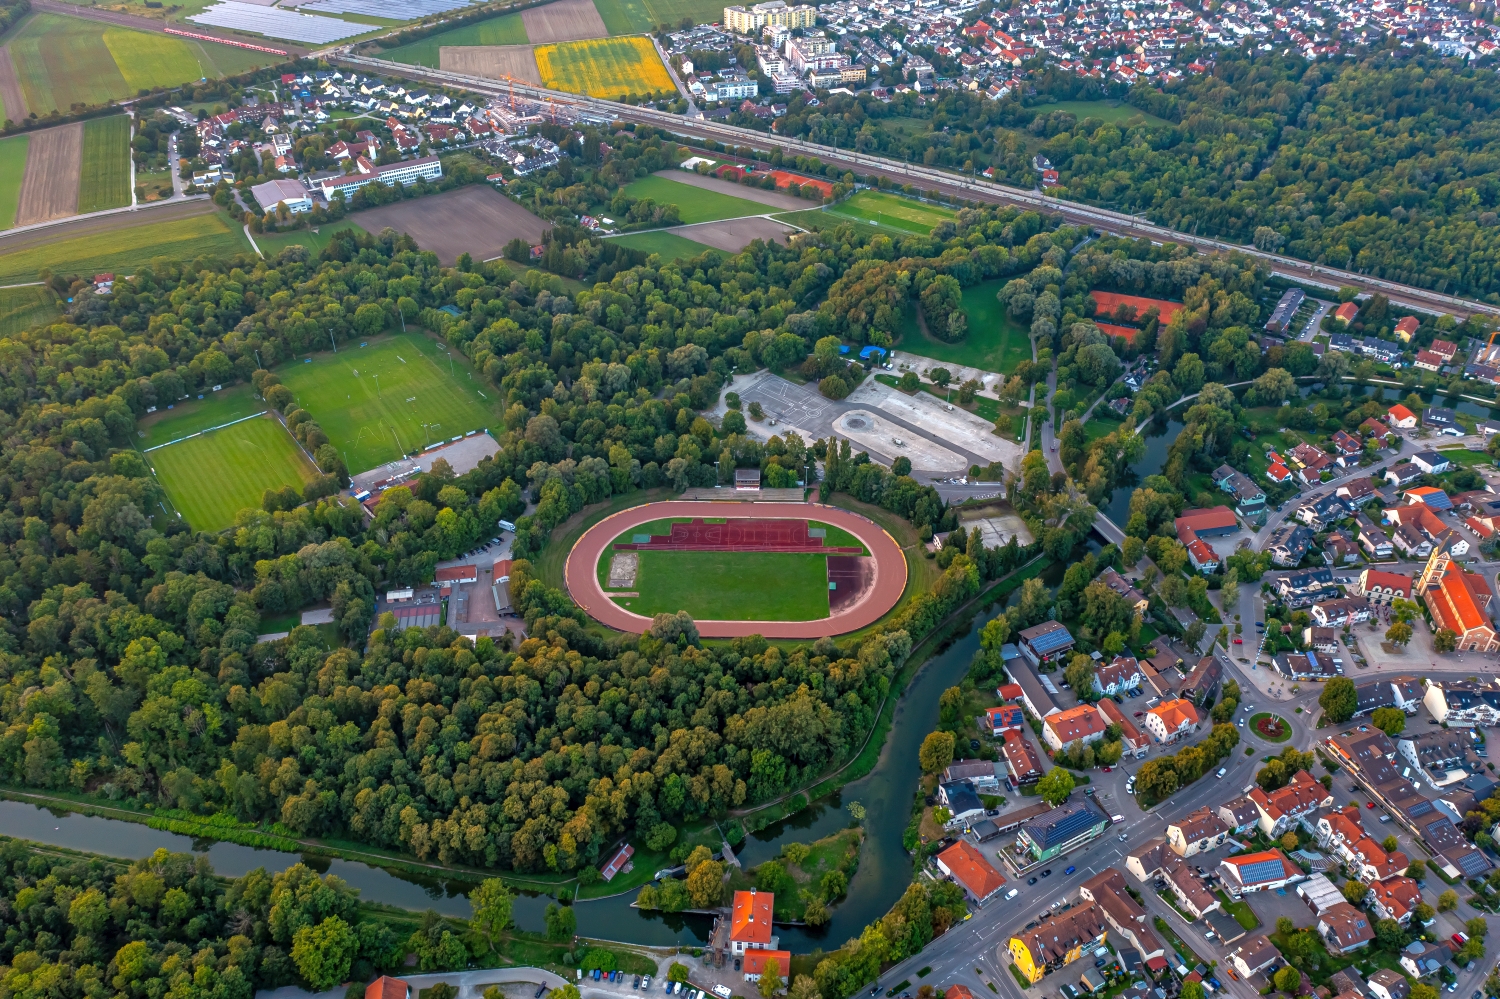
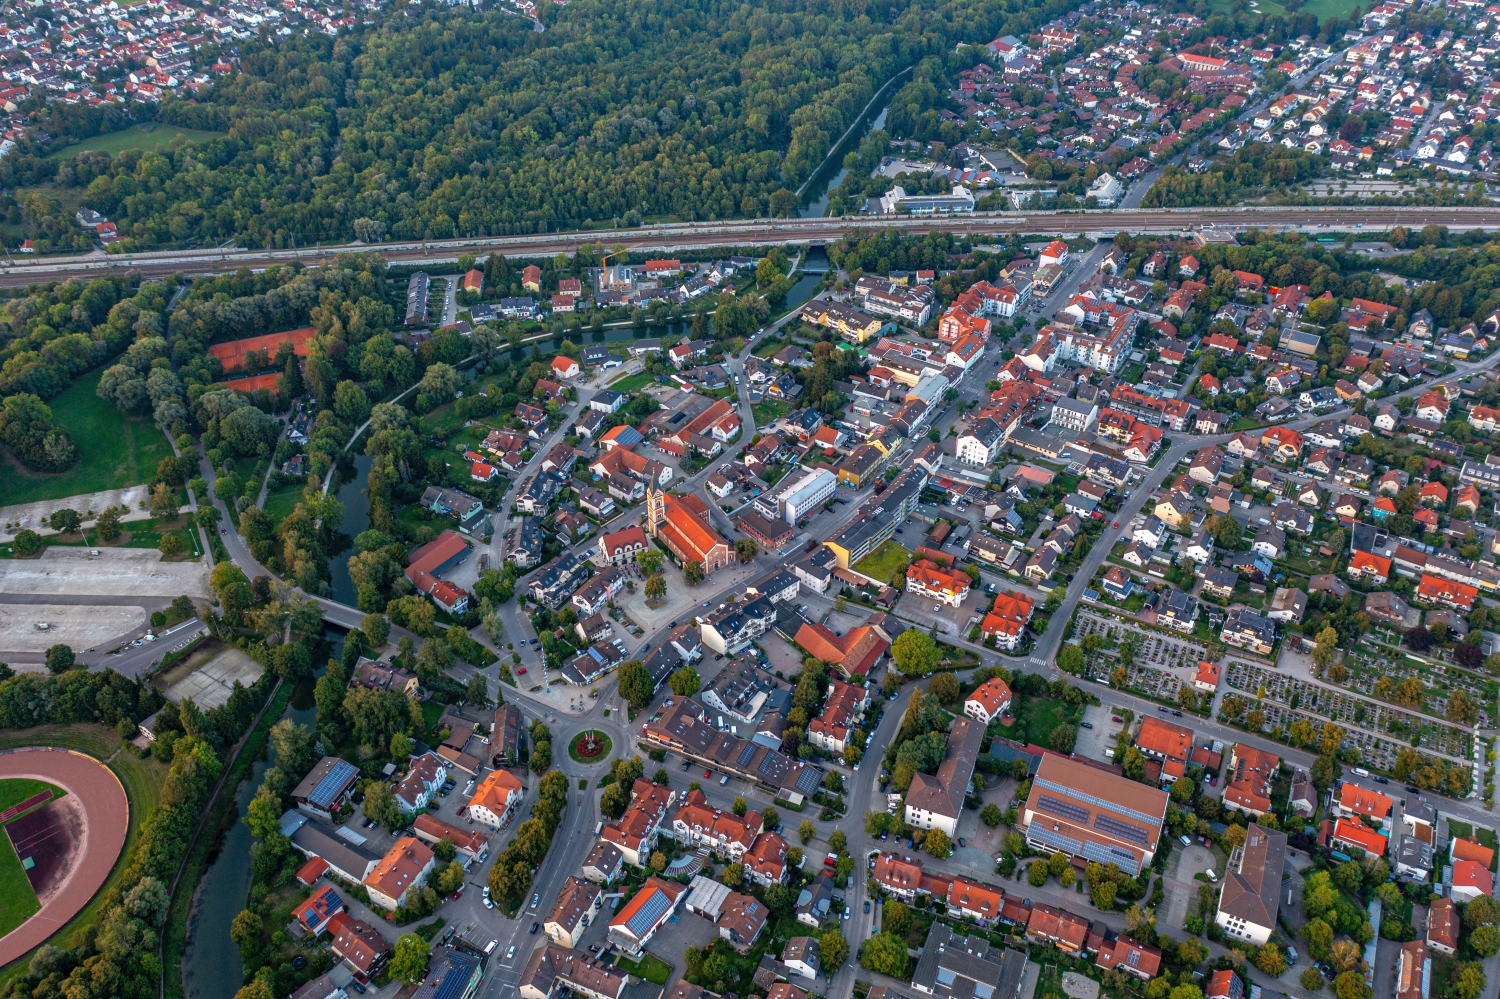
In Olching, the oval running track is easy to find from the overview. There are residential areas close by, fields and larger halls further out. The differences in size almost explain the city layout by itself if the photo includes the transition to the open landscape.
The sports oval as orientation
The running track in Olching has an easily recognizable shape and shows how large the neighboring districts are. Just a few streets further out, the relationship shifts. Individual fields fill more image space than several rows of houses next to each other.
Sports areas bring easily recognizable shapes into an otherwise irregularly structured townscape. Usually only the near side of a system is visible from the ground, but the entire outer contour can be read from above. This makes them a good size comparison for the neighborhood. A precise measurement does not replace this view. However, it helps to meaningfully compare the width of adjacent streets, the extent of the groups of houses and the distance to the nearest green space within the same image.
What becomes visible on the edge of town
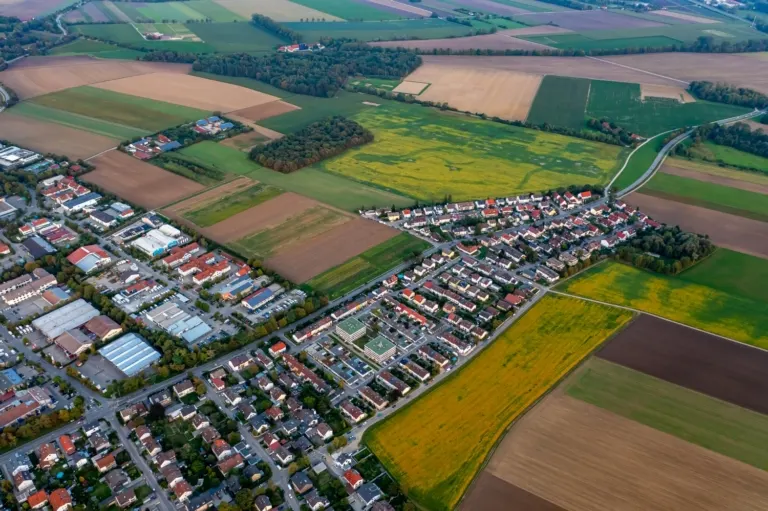
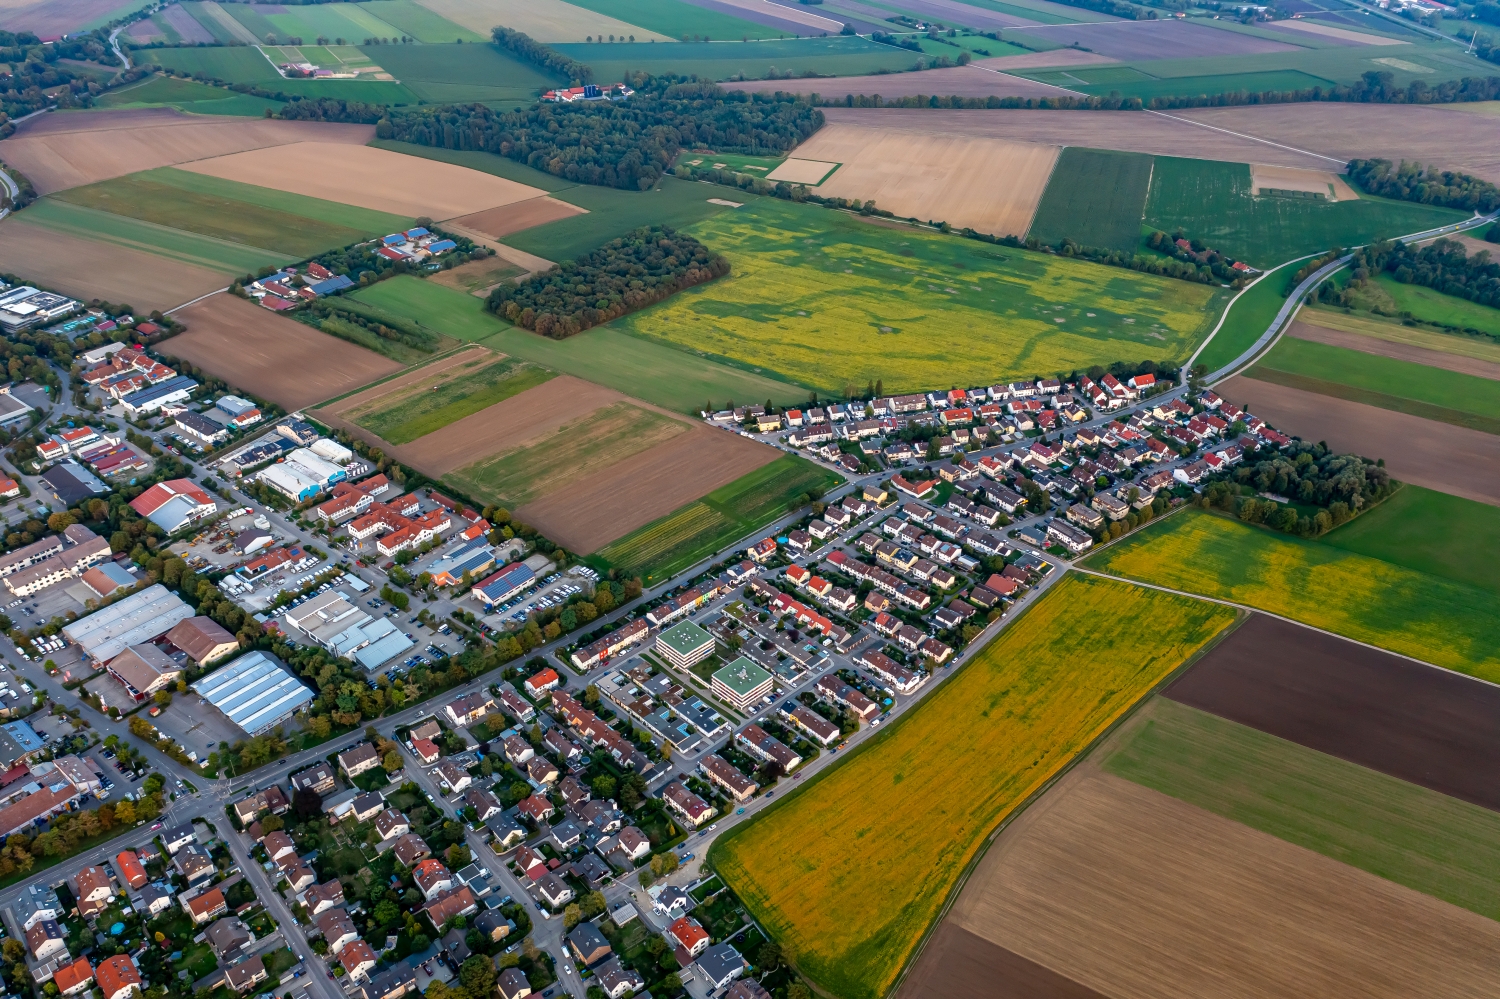
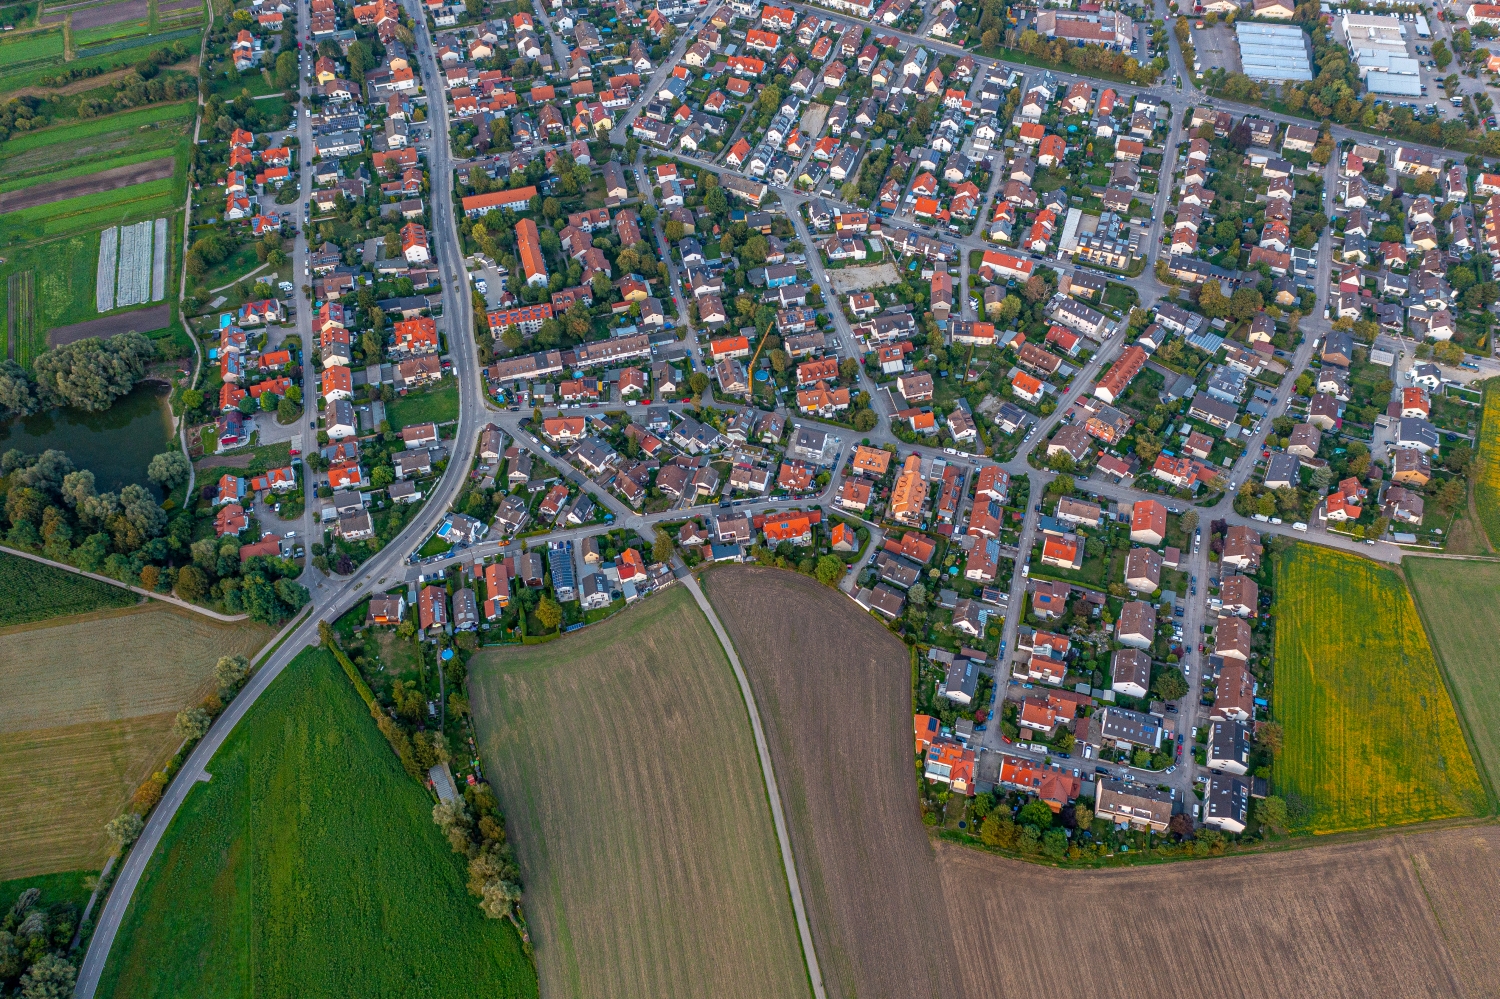
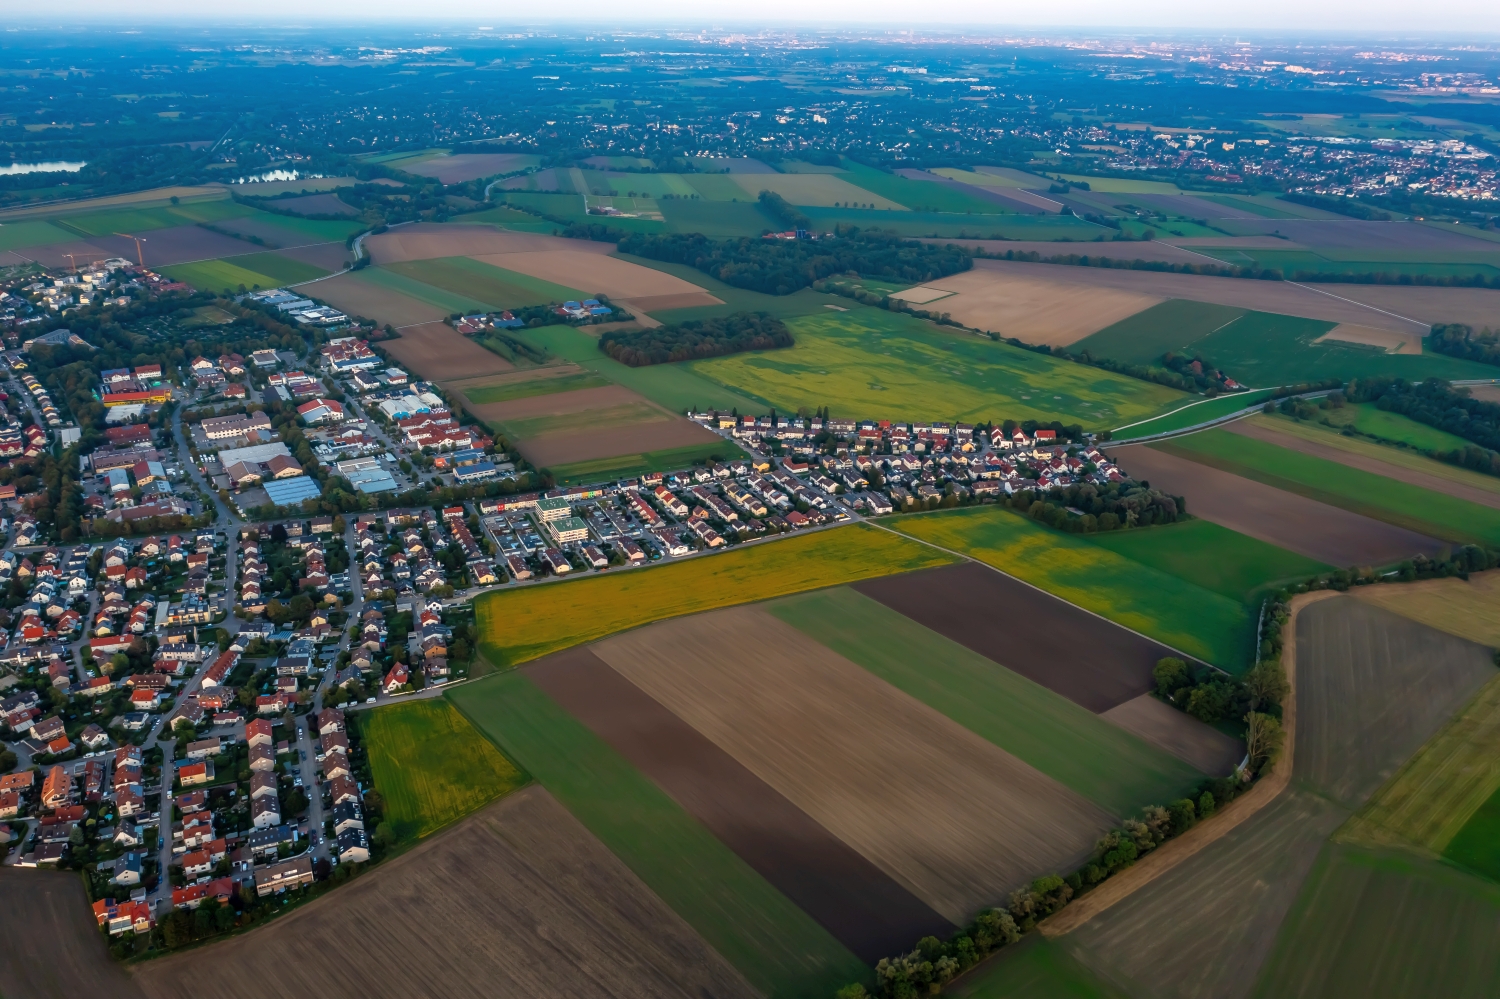
On the edge of town, several scales come together in a small section. On one side there are individual buildings with gardens and driveways. On the other hand, a single open area sometimes takes up as much space as several streets. This change can be shown in the picture over a common edge. A section in which the border between the two areas remains visible even when displayed narrowly is suitable for a website. The motif then retains its local reference even in the mobile view.
Field boundaries as a benchmark
From a greater height, the field appears to be an orderly floor plan. A closer look shows how the paths change direction at curves, embankments and property boundaries. When selecting images, it is helpful to preserve at least one of these transition points. It turns a colored area into a piece of actually used landscape. For an article about the surrounding area, even the inconspicuous edge of a field can explain more than a wide section that only shows numerous plots as small spots.
The distribution of blue tones
Among the 29 photos in the gallery, shot 29 and shot 2 provide a good starting point for the comparison. In the first excerpt, shades of blue play a smaller role. In the second shot, blue areas take up more space. Blue can extend over a large contiguous area or only appear in individual parts. What also counts for the effect is whether these areas extend to the edge of the picture or surround the main subject.
The camera captured August 21, 2023 for shot 1 and shot 29. The time interval between these two views is approximately 8 minutes. The exposure time was 1/80 second for the first of the images mentioned and 1/30 second for the second.
An image for spatial documentation
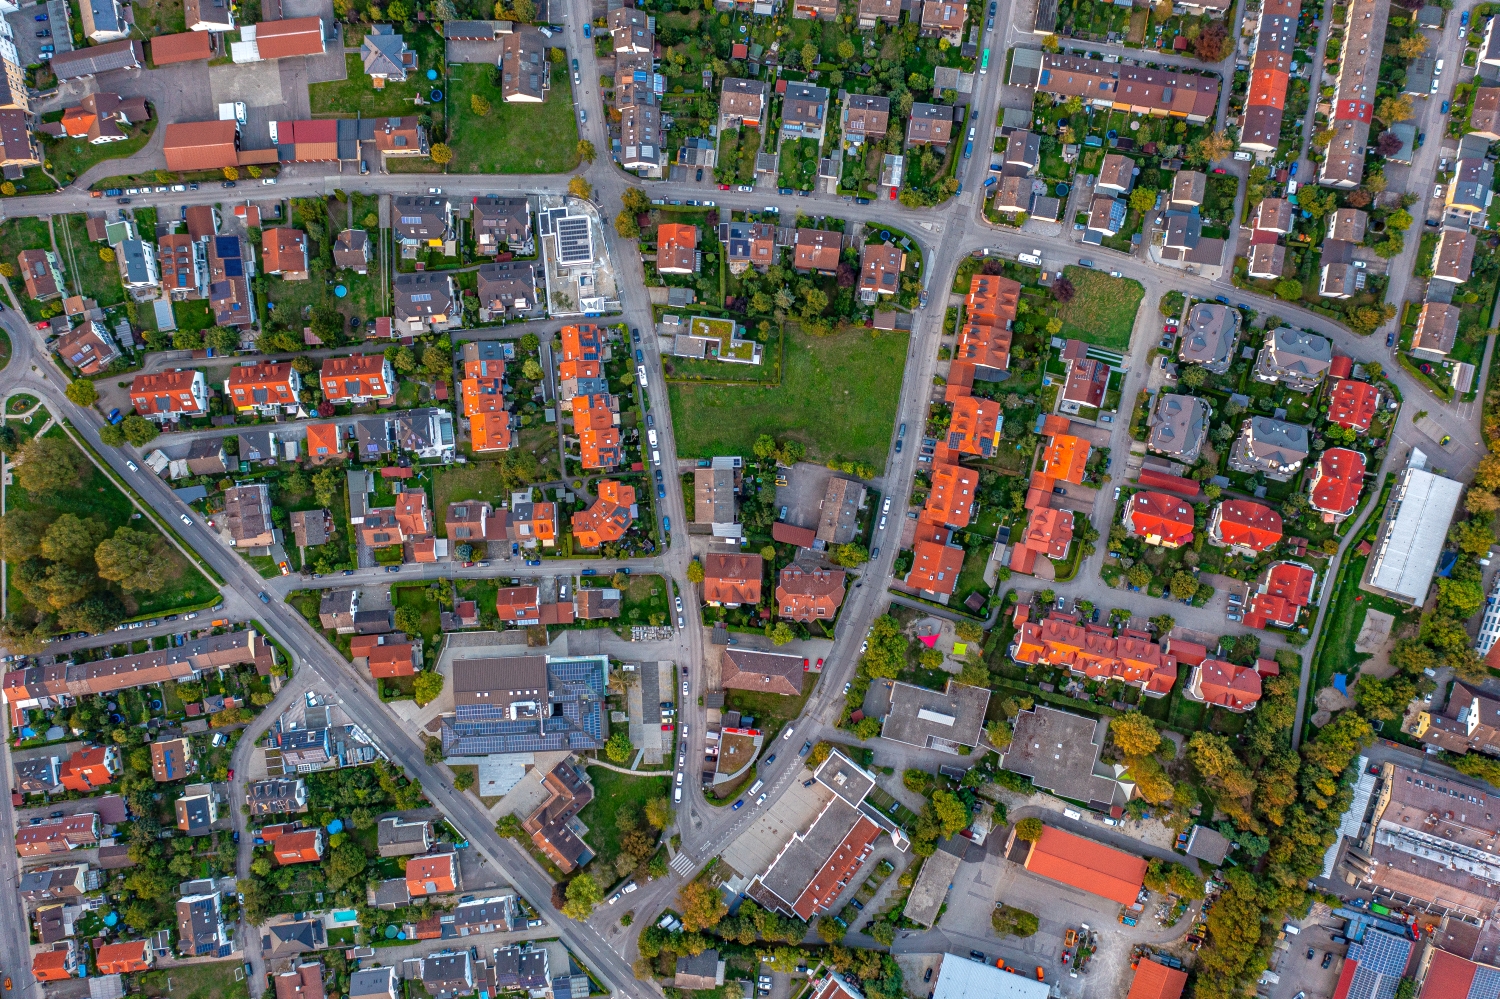
In the case of a technical system, the direction of view determines which relationships can be explained. The course is clear along a traffic axis, and across it often the connection to the neighborhood. Both questions are valid for a project portrait. The aerial photographer can treat them in separate views. When publishing later, it will help to organize the selection according to these questions. Two visually different images can otherwise repeat the same information, while an entrance, a crossing or the connection to a neighboring property remains incomprehensible.
More aerial photos for comparison
Two further articles invite comparison. In the first, Pittersberg Gemeinde Ebermannsdorf, another detail is in the foreground. The district of Pittersberg in the municipality of Ebermannsdorf stands out from the patchwork of fields with bright buildings and red roofs. Then Esselbach is a good option. Esselbach stretches over moving terrain in which arable land and forest come close to the houses.